Descrizione
COSA FA
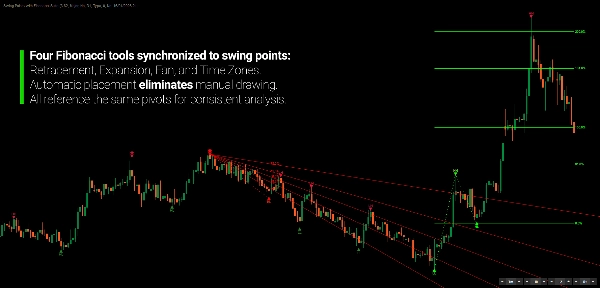
Disegna automaticamente quattro strumenti di Fibonacci dalla rilevazione unificata degli swing—eliminando la soggettività e mantenendo la coerenza interna tra ritracciamento, espansione, ventaglio e zone temporali.
Il disegno manuale di Fibonacci è potente ma soggettivo. Diversi trader tracciano livelli differenti sullo stesso grafico. Gli strumenti di Fibonacci automatizzati offrono tipicamente un solo tipo di analisi — ritracciamento O espansione O ventaglio — costringendoti ad aggiungere più indicatori o a disegnare manualmente il resto.
Questo indicatore integra quattro strumenti di Fibonacci in un unico sistema.
Ritracciamento, Espansione, Ventaglio e Zone Temporali sono calcolati automaticamente dalla stessa logica di rilevazione degli swing. Quando si forma un nuovo pivot strutturale, tutti e quattro gli strumenti si aggiornano in tempo reale, ancorati agli stessi punti di swing. Nessun disegno manuale. Nessuna variazione interpretativa. Nessun cambio tra strumenti.
Il risultato è un'analisi completa di Fibonacci che mantiene la coerenza interna.
PERCHÉ FIBONACCI AUTOMATIZZATO È IMPORTANTE
L'analisi di Fibonacci è ampiamente utilizzata perché riflette come i mercati si ritirano ed estendono naturalmente. Il rapporto aureo appare costantemente nella struttura dei prezzi, rendendo i livelli di Fibonacci punti di riferimento preziosi per supporto, resistenza e obiettivi di proiezione.
Il Problema
L'analisi manuale di Fibonacci introduce tre sfide pratiche:
- Soggettività — Diversi trader selezionano punti di swing differenti
- Consumo di tempo — Disegnare quattro strumenti su più timeframe richiede un notevole lavoro sul grafico
- Incoerenza — Ritracciamento da swing A-B, espansione da B-C, ventaglio da C-D crea un'analisi disconnessa
In pratica, gli strumenti di Fibonacci automatizzati spesso risolvono il problema del tempo, ma si basano ancora su logiche di swing disconnesse. Disegneranno automaticamente i ritracciamenti, ma posizionerai ancora manualmente gli strumenti di espansione e ventaglio da swing differenti.
La Soluzione
Questo indicatore applica tutti e quattro gli strumenti di Fibonacci a un unico modello di swing condiviso. Quando l'algoritmo identifica i punti di swing A, B e C:
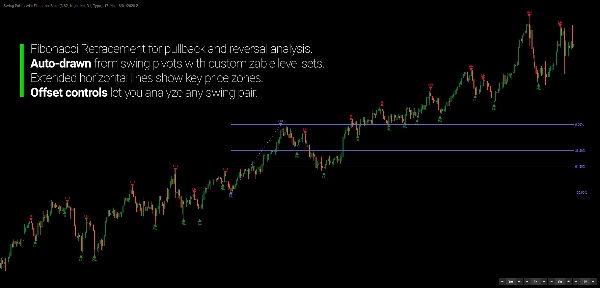
- Il ritracciamento viene disegnato dalla coppia di swing più recente
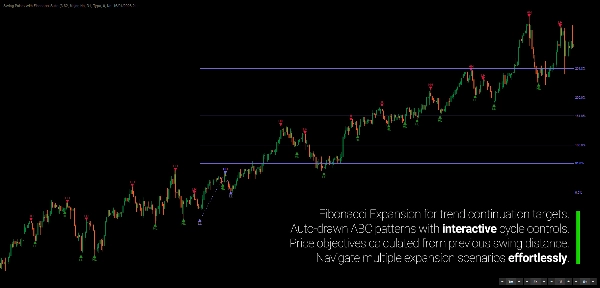
- L'espansione proietta basandosi sulla struttura a tre swing
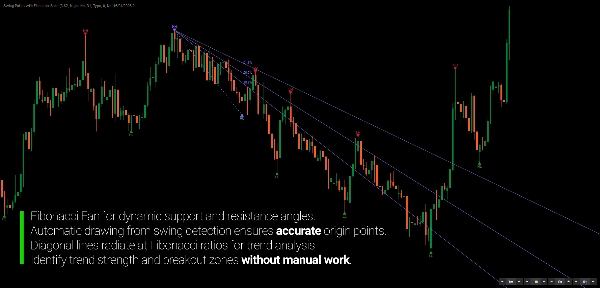
- Il ventaglio si irradia dal punto di ancoraggio dello swing
- Le zone temporali segnano intervalli in avanti dal swing base
Ogni strumento fa riferimento agli stessi pivot strutturali, mantenendo l'intera analisi internamente coerente attraverso tutte le visuali di Fibonacci.
IL CONCETTO FONDAMENTALE
Rilevazione degli Swing
L'indicatore utilizza il metodo di regressione per smussare l'azione del prezzo e identificare i punti pivot strutturali. A differenza degli estremi di prezzo semplici o dei crossover di indicatori, la regressione produce pivot che riflettono cambiamenti di tendenza genuini invece della volatilità momentanea.
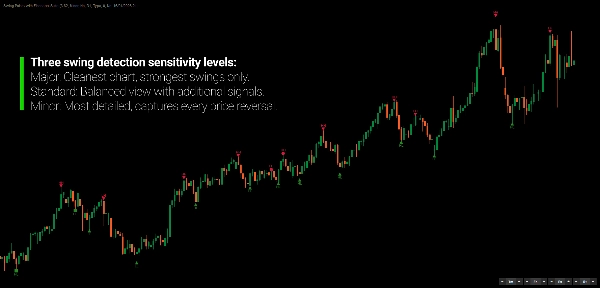
Tre modalità di rilevazione controllano la sensibilità:
- Maggiore — Filtro più rigoroso, identifica solo i pivot della struttura di mercato primaria
- Standard — Approccio bilanciato per i timeframe di swing trading
- Minore — Include swing contro-tendenza all'interno di trend più ampi per un'analisi dettagliata
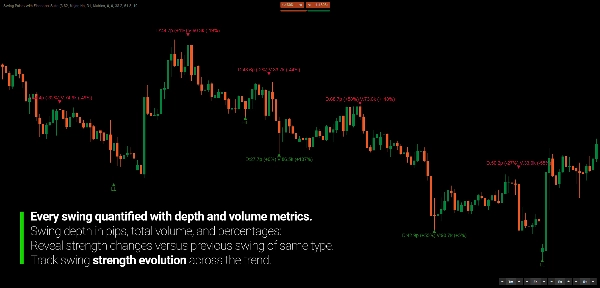
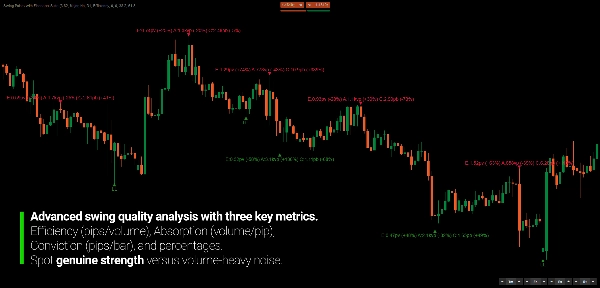
Ogni swing è classificato (HH, HL, LH, LL) e opzionalmente etichettato con metriche: profondità, volume, durata, efficienza, assorbimento e convinzione. Le percentuali comparative mostrano come la forza dello swing attuale si rapporta agli swing precedenti dello stesso tipo.
Integrazione di Fibonacci
Una volta rilevati gli swing, quattro strumenti di Fibonacci vengono disegnati automaticamente:
- Ritracciamento — Livelli orizzontali dalla coppia di swing più recente
- Espansione — Proiezioni di prezzo basate sulla struttura ABC
- Ventaglio — Canali di tendenza diagonali dal punto di ancoraggio
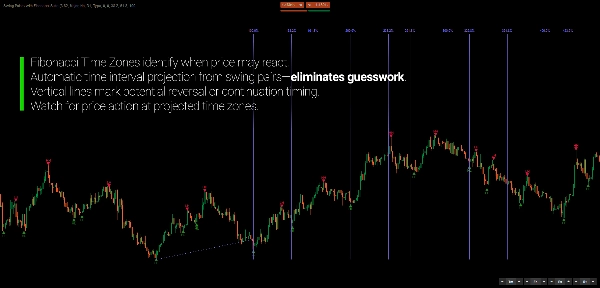
- Zone Temporali — Proiezioni temporali verticali usando intervalli di Fibonacci
Ogni strumento ha un controllo indipendente dello spostamento tramite pulsanti sul grafico. Regola quale coppia di swing guida ogni tipo di analisi senza ricalcolare o ridisegnare manualmente.
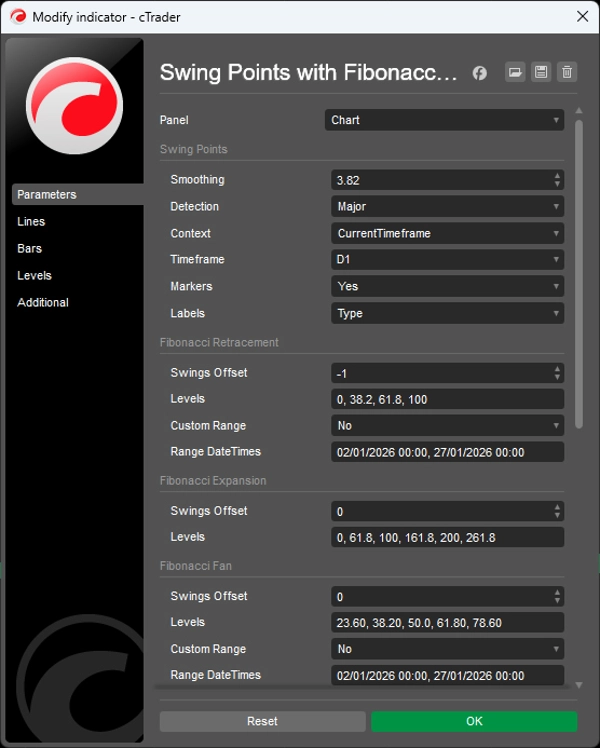
Tutti e quattro gli strumenti possono anche operare in modalità intervallo personalizzato, dove specifichi esattamente orari di inizio/fine invece di usare gli swing rilevati — utile per analizzare eventi o sessioni di mercato specifici.
Contesto Multi-Timeframe
L'indicatore può rilevare swing su un timeframe superiore mentre viene visualizzato sul tuo grafico attuale. Visualizza gli swing giornalieri e i loro livelli di Fibonacci su un grafico H1 senza cambiare timeframe.
Questo fornisce un contesto strutturale dai timeframe superiori direttamente sui grafici di esecuzione, aiutando ad allineare gli ingressi con la direzione più ampia del mercato.
CARATTERISTICHE PRINCIPALI
Rilevazione degli Swing
- Filtraggio tramite regressione per identificazione dei pivot strutturali
- Tre modalità di rilevazione: Maggiore (struttura primaria), Standard (swing trading), Minore (swing interni dettagliati)
- Capacità multi-timeframe — rileva swing su TF superiore, visualizza su grafico TF inferiore
- Classificazione degli swing — etichette HH/HL/LH/LL confermano la struttura di tendenza
- Tre tipi di marker — Triangolo (confermato), Cerchio (solo stato), Quadrato (swing interni)
Strumenti di Fibonacci
- Ritracciamento — nove livelli configurabili (0% a 100%)
- Espansione — otto livelli di proiezione (0% a 261,8%)
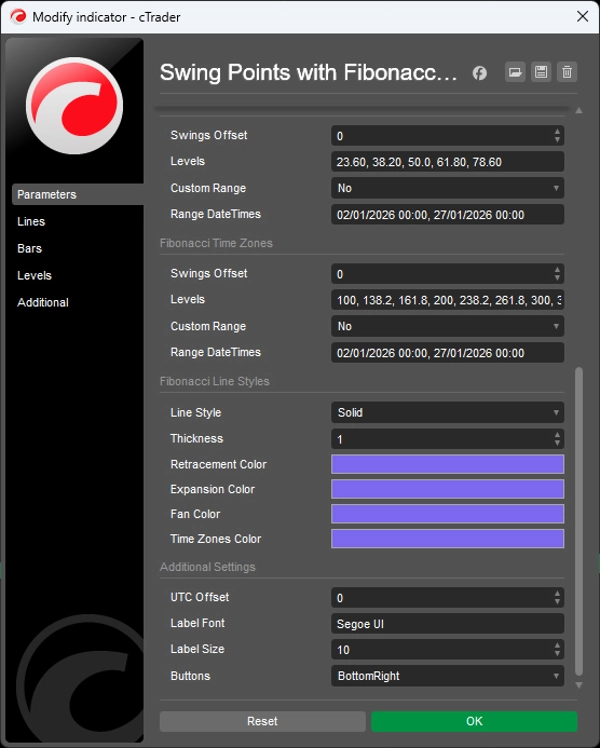
- Ventaglio — cinque canali diagonali (23,6% a 78,6%)
- Zone Temporali — nove intervalli temporali (100% a 322,8%)
- Controlli indipendenti dello spostamento per ogni strumento tramite pulsanti UI sul grafico
- Modalità intervallo personalizzato — sovrascrivi la rilevazione degli swing con intervalli datetime manuali
Metriche degli Swing
- Metriche base — Profondità (pips), Volume (volume tick), Durata (barre)
- Rapporti di efficienza — Efficienza (pips per volume), Assorbimento (volume per pip), Convinzione (pips per barra)
- Analisi comparativa — variazione percentuale rispetto allo swing precedente dello stesso tipo
A CHI È DESTINATO
Questo indicatore è progettato per trader che usano Fibonacci come riferimento strutturale piuttosto che come segnale autonomo.
Se disegni regolarmente ritracciamenti, estensioni o zone temporali di Fibonacci, questo strumento sistematizza quel processo. Invece di posizionare manualmente più strumenti su swing differenti, l'indicatore mantiene tutti e quattro simultaneamente dagli stessi punti di riferimento strutturali.
È adatto per trader swing e di posizione che analizzano più timeframe e vogliono la struttura del timeframe superiore visibile sui grafici di esecuzione. I trader focalizzati su Fibonacci trarranno beneficio dall'avere ritracciamento, espansione, ventaglio e analisi temporale unificati in un unico framework.
Gli analisti multi-timeframe possono visualizzare swing giornalieri o settimanali su grafici intraday senza cambiare finestra, mentre gli analisti tecnici ottengono accesso alle metriche degli swing (efficienza, assorbimento, convinzione) che normalmente richiedono calcoli manuali.
Questo non è un sistema di segnale di ingresso. È un framework strutturale per interpretare Fibonacci nel contesto di mercato — riducendo il lavoro manuale di grafico mantenendo la profondità analitica che rende preziosi gli strumenti di Fibonacci.
COSA LO RENDE DIVERSO
Applicare più strumenti di Fibonacci di solito significa lavorare con più interpretazioni degli swing. Senza un riferimento strutturale unificato, combinare ritracciamenti, espansioni, ventagli e proiezioni temporali può risultare in prospettive disconnesse piuttosto che in un framework coerente.
Questo indicatore unifica tutti e quattro gli strumenti sotto un unico algoritmo di rilevazione degli swing. Ogni vista di Fibonacci è costruita sugli stessi pivot strutturali, assicurando che le diverse proiezioni riflettano lo stesso contesto di mercato sottostante.
L'approccio di regressione filtra la volatilità a breve termine preservando la rilevanza strutturale. La modalità maggiore identifica solo i pivot di mercato primari. La modalità minore rivela la struttura contro-tendenza dettagliata all'interno di swing più ampi. Lo stesso algoritmo, sensibilità diversa.
La capacità multi-timeframe porta il contesto del timeframe superiore ai grafici di esecuzione senza cambiare grafico. Vedi gli swing giornalieri e la loro analisi completa di Fibonacci su un grafico H1 — contesto strutturale al tuo timeframe di trading.
I controlli indipendenti dello spostamento permettono l'analisi simultanea di più strutture di swing. Ritracciamento dallo swing più recente mentre l'espansione proietta dalla configurazione precedente. Tutto controllato tramite pulsanti sul grafico senza modifiche al pannello dei parametri.
---
COMPRENDERE FIBONACCI NELLA STRUTTURA DI MERCATO
I rapporti di Fibonacci appaiono in molti sistemi naturali, inclusi i mercati finanziari. La tendenza dei ritracciamenti a fermarsi vicino ai livelli 38,2%, 50% o 61,8%, e delle estensioni a raggiungere proiezioni del 127,2% o 161,8%, riflette la geometria sottostante del mercato piuttosto che proprietà mistiche.
Questi livelli diventano in parte autoavveranti — abbastanza trader li osservano da influenzare il flusso degli ordini — ma la loro persistenza attraverso timeframe e strumenti suggerisce qualcosa di più strutturale.
Da un punto di vista pratico, i livelli di Fibonacci forniscono punti di riferimento oggettivi in un'analisi grafica altrimenti soggettiva. Piuttosto che indovinare dove potrebbe formarsi un supporto in un ritracciamento, il ritracciamento di Fibonacci ti dà zone di prezzo specifiche da monitorare.
La sfida non è se Fibonacci funziona — è mantenere la coerenza nel modo in cui lo applichi. L'analisi manuale introduce variazioni: da quale swing misuri? Usi le ombre o le chiusure? Come gestisci i ritracciamenti sovrapposti da più coppie di swing?
L'applicazione sistematica elimina queste domande. L'algoritmo seleziona gli swing con gli stessi criteri ogni volta. Tutti e quattro gli strumenti fanno riferimento agli stessi pivot. L'analisi diventa replicabile e comparabile in diverse condizioni di mercato.
Questo non elimina la discrezionalità — decidi ancora quale offset di swing analizzare, quali livelli sono importanti per la tua configurazione e come interpretare la congiunzione tra strumenti. Ma stabilisce una base coerente per quella discrezionalità.
---
Il trading comporta rischi. Questo indicatore è uno strumento di analisi tecnica — applica sempre una corretta gestione del rischio.


