설명
무엇을 하는가
유동성 기반 지지 및 저항은 단순히 선을 그릴 수 있는 위치가 아니라 실제로 가격이 반전된 위치를 식별합니다.
차트 전반의 스윙 포인트를 감지하고 이를 심리적 원형 가격 수준에 매핑하며 각 구역에서의 매수/매도 활동을 정량화합니다. 어떤 수준이 의미 있는 유동성 활동을 보이는지, 어떤 수준이 단순한 빈 선인지 확인할 수 있습니다.
결과는 맥락 — 편향, 거래량 흡수, 효율성 및 실행 가능한 해석이 내장된 지지와 저항입니다.
왜 중요한가
전통적인 지지 및 저항 방법은 공통적인 약점을 가지고 있습니다: 가격이 어디에 있었는지 보여주지만, 그곳에서 무슨 일이 일어났는지에 대해서는 아무것도 알려주지 않습니다.
두 번 터치된 가격 수준과 무거운 거래량으로 15번 테스트된 수준은 표준 SR 지표에서 동일하게 보입니다. 그러나 가격이 돌아올 때 그들은 매우 다르게 행동합니다.
문제점
스윙 포인트에 선을 그리는 것은 쉽습니다. 그러나 그 수준이 유지될지, 깨질지, 또는 트레이더를 함정에 빠뜨릴지 이해하려면 대부분의 SR 도구가 제공하지 않는 더 깊은 분석이 필요합니다:
- 해당 수준에서 실제로 몇 번의 반전이 발생했는가?
- 매수자와 매도자 중 누가 우세했는가?
- 반전이 효율적이었는가, 아니면 대량의 거래량 흡수가 필요했는가?
- 그 수준이 돌파를 위한 에너지를 축적하고 있는가, 아니면 실패 전에 분배되고 있는가?
해결책
이 지표는 각 수준에서 유동성 서명을 측정합니다 — 몇 번의 반전이 발생했는지, 반전이 얼마나 깊었는지, 얼마나 많은 거래량이 포함되었는지, 그리고 매수자와 매도자 중 누가 더 효율적으로 작동했는지.
어떤 수준이 중요한지 추측하는 대신, 각 구역에서 시장이 정확히 무엇을 하고 있는지 볼 수 있습니다.
작동 원리
적응형 스윙 감지
이 지표는 회귀 기반 평활화 방법을 사용하여 시장 노이즈를 필터링하고 진정한 스윙 포인트 — 가격이 방향 전환에 전념한 순간, 무작위 꼬리가 아닌 — 를 식별합니다.
세 가지 감지 모드가 제공됩니다:
- 주요 — 확인된, 강한 확신의 반전만
- 표준 — 모든 주요 스윙 구조
- 부차적 — 세밀한 분석을 위한 내부 스윙 포함
원형 가격 구역 매핑
스윙 포인트는 자동으로 심리적 가격 수준에 매핑됩니다. 구역 간격은 평균 스윙 깊이에 기반하여 귀하의 상품 변동성에 맞게 조정되며 수동 설정이 필요 없습니다.
배수를 0으로 설정하면 지표가 최적의 간격을 자동으로 계산합니다.
유동성 지표
각 구역에서 지표는 다음을 계산합니다:
- 깊이 — 스윙 포인트에서 가격이 이동한 거리 (핍 단위)
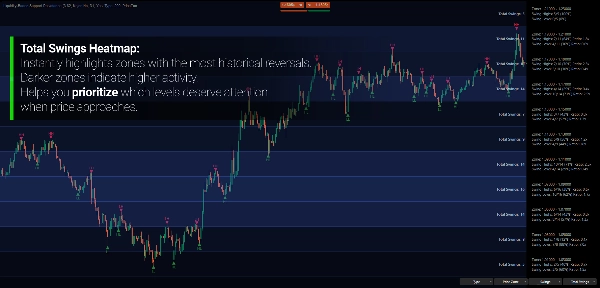
- 거래량 — 스윙 동안의 전체 틱 활동
- 효율성 — 거래량 단위당 가격 움직임 (실행 효율성 측정)
- 흡수 — 가격 움직임을 억제하는 데 필요한 거래량 (수준 유지 노력)
- 확신 — 바당 가격 움직임 (모멘텀 및 의지)
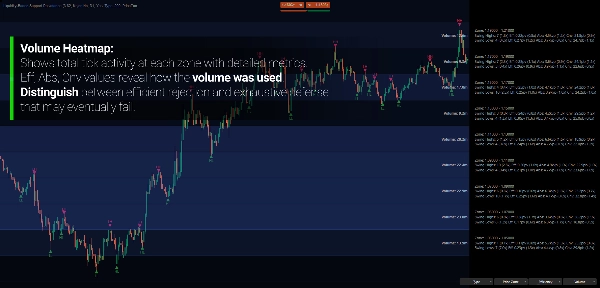
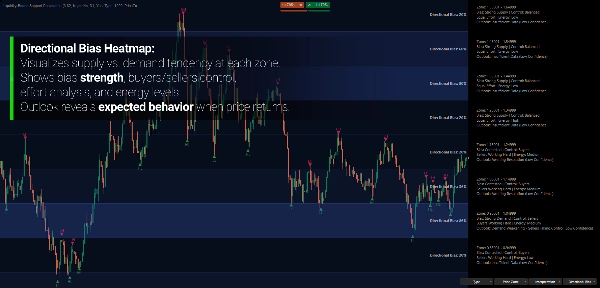
방향성 분석
각 구역은 다음에 대해 분석됩니다:
- 편향 — 이 구역이 공급 구역(스윙 고점이 더 많음)인지 수요 구역(스윙 저점이 더 많음)인지?
- 통제 — 매수자 또는 매도자가 여기서 더 효율적으로 작동하고 있는가?
- 에너지 — 기준선 대비 총 활동량은 얼마나 되는가?
이 지표들은 결합되어 각 수준에서 무슨 일이 일어나고 있는지에 대한 자연어 해석을 생성합니다.
주요 기능
다중 라벨 모드
- 가격 — 간단한 구역 식별
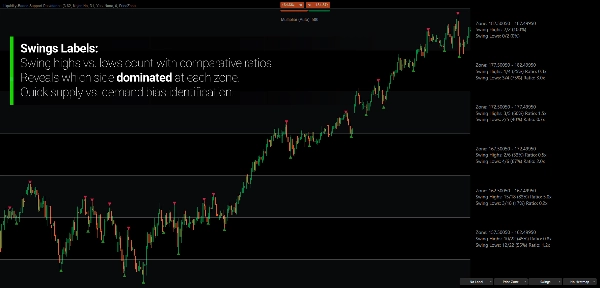
- 스윙 — 스윙 고점과 저점의 개수 및 비율
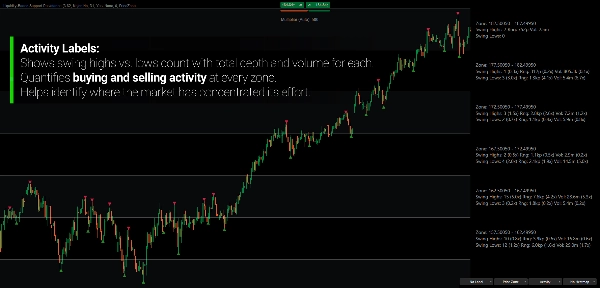
- 활동 — 깊이, 거래량 및 비교 비율
- 효율성 — 기관의 정밀도를 보여주는 계산된 지표
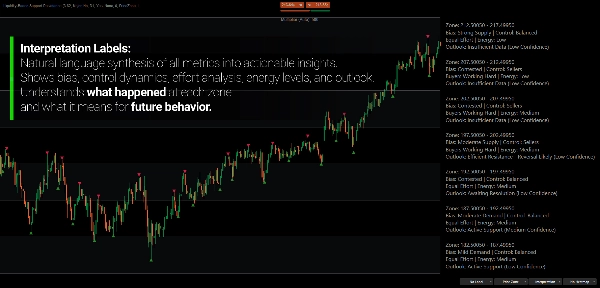
- 해석 — 편향, 통제 및 전망에 대한 자연어 분석
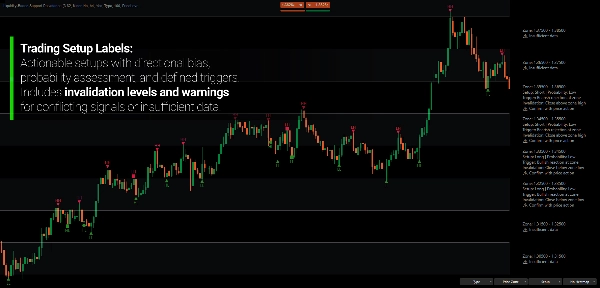
- 설정 — 트리거, 무효화 및 확률이 포함된 실행 가능한 거래 설정
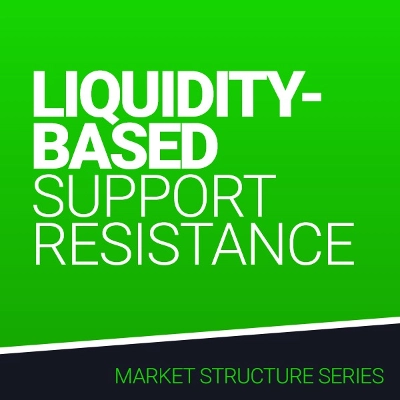
히트맵 시각화
원시 데이터를 즉각적인 시각적 통찰력으로 변환합니다. 히트맵은 모든 표시된 구역에 걸쳐 세 점 색상 그라데이션 — 차가움, 중간, 뜨거움 — 을 사용하여 어떤 지표든 인코딩합니다.
각 수준에서 숫자를 읽는 대신 한눈에 패턴을 볼 수 있습니다:
- 거래량이 어디에 집중되고 있는가?
- 어떤 구역이 강한 방향성 편향을 보이는가?
- 효율성이 가장 높은 곳은 어디인가?
- 어떤 수준이 가장 많은 노력을 흡수했는가?
17가지 히트맵 모드가 제공됩니다:
- 활동 — 총 스윙, 스윙 고점, 스윙 저점
- 비율 — 고점/저점 비율, 깊이 비율, 거래량 비율, 지속 시간 비율
- 원시 지표 — 깊이, 거래량
- 계산된 지표 — 효율성, 흡수, 확신, 방향성 편향
다중 타임프레임 분석
낮은 타임프레임 가격 움직임을 보면서 높은 타임프레임 스윙 구조를 분석합니다. 차트를 전환하지 않고도 일간 스윙 활동을 H1 구역에 매핑된 상태로 볼 수 있습니다.
이중 표시 모드
- 가격 수준 — 원형 가격에 전통적인 단일 선
- 가격 구역 — 전체 구역 너비를 보여주는 상한 및 하한 경계
적응형 구역 간격
배수를 0으로 설정하면 지표가 귀하의 상품 평균 스윙 깊이에 기반하여 최적의 구역 너비를 자동으로 계산합니다. 수동 조정 없이 외환, 지수, 암호화폐 및 원자재에 걸쳐 작동합니다.
해석 및 설정 모드
이 지표는 단순히 데이터를 보여주는 것이 아니라 — 실행할 수 있는 분석으로 지표들을 종합합니다.
해석 모드는 다음을 제공합니다:
- 편향 평가 (강한/중간/약한 공급 또는 수요)
- 통제 식별 (매수자, 매도자 또는 균형)
- 노력 분석 (누가 포지션 유지를 위해 더 열심히 일하는가)
- 에너지 수준 (기준선 대비 높음/중간/낮음)
- 가능한 행동을 설명하는 전망 문구
설정 모드는 더 나아갑니다:
- 방향성 편향 (롱, 숏 또는 중립)
- 진입 트리거 조건
- 무효화 기준
- 확률 평가 (높음/중간/낮음/매우 낮음)
- 신호 충돌 시 경고
예시 출력:
"설정: 롱 | 확률: 중간" "트리거: 구역 상단 돌파 및 종가" "무효화: 구역 하단 종가"
구역 읽기
공급 구역 — 저점보다 고점이 더 많습니다. 가격은 이곳에서 하락 반전하는 경향이 있습니다. 매도자들이 이 수준을 역사적으로 방어해왔습니다.
수요 구역 — 고점보다 저점이 더 많습니다. 가격은 이곳에서 상승 반전하는 경향이 있습니다. 매수자들이 이 수준을 역사적으로 방어해왔습니다.
경쟁 구역 — 대략 동등한 스윙 고점과 저점. 명확한 방향성 편향이 없습니다. 해결되면 폭발적인 움직임을 자주 만듭니다.
높은 에너지 — 기준선 대비 상당한 거래량 흡수. 이 수준은 적극적으로 다투어지고 있습니다.
낮은 에너지 — 최소한의 활동. 이 수준은 쉽게 깨지거나 무시될 수 있습니다.
효율성 불균형 — 한쪽이 거래량 단위당 가격을 더 멀리 움직일 때, 누가 더 많은 노력을 기울이든 간에 그 쪽이 통제권을 가집니다.
대상 사용자
이 지표는 단순한 차트상의 선이 아닌 수준 뒤에 있는 맥락을 원하는 트레이더를 위해 설계되었습니다.
거래량 분석, 노력 대비 결과, 공급/수요 역학과 같은 개념을 의사결정에 통합하는 구조 기반 트레이더에게 적합합니다.
스윙 및 포지션 트레이더는 기관 무게가 실린 수준을 보고 진입 계획을 세우는 데 도움을 받을 수 있습니다.
다중 타임프레임 분석가는 실행 차트에서 직접 높은 타임프레임 유동성 구조를 볼 수 있습니다.
이것은 신호 생성기가 아닙니다. 이는 중요 가격 수준에서 시장이 무엇을 하고 있었는지 이해하기 위한 맥락적 프레임워크이며, 미래 행동에 대해 무엇을 시사하는지 보여줍니다.
차별점
대부분의 지지 및 저항 지표는 다음 질문에 답합니다: "가격이 어디서 반전했는가?"
이 지표는 다음에 답합니다: "가격이 그곳에서 반전했을 때 무슨 일이 일어났으며, 그것이 우리에게 무엇을 알려주는가?"
각 수준에서 활동을 정량화함으로써 — 단순히 스윙이 발생한 위치를 표시하는 것이 아니라 — 다음에 대한 통찰을 얻습니다:
- 수준이 유지될 가능성이 있는지 또는 깨질 가능성이 있는지
- 어느 쪽이 더 효율적으로 작동했는지
- 돌파를 위한 에너지가 축적되고 있는지 또는 소진되고 있는지
- 명확한 트리거와 무효화가 포함된 수준 주변의 거래 구조 방법
분석은 귀하의 상품에 자동으로 적응합니다. 최적화가 필요 없으며 — 시장 구조가 매개변수를 정의합니다.
---
가격 수준에서의 유동성 이해
지지와 저항은 가격이 튕기는 마법의 선이 아닙니다. 그것들은 상반된 이해관계가 집중되는 구역입니다.
지지 수준에서는 매수자들이 역사적으로 매도 압력을 흡수하려 했습니다. 저항에서는 매도자들이 매수 압력을 흡수했습니다. 수준의 강도는 몇 번 터치되었는지가 아니라 그 수준을 유지하는 데 얼마나 많은 노력이 필요했는지 — 그리고 그 방어가 여전히 유지되는지에 달려 있습니다.
이것이 동일한 가격 이력을 가진 두 수준이 완전히 다르게 행동할 수 있는 이유입니다. 하나는 유지하기 위해 엄청난 거래량을 흡수했을 수 있으며 — 이는 결국 소진을 시사합니다. 다른 하나는 가격을 무리 없이 반전시켰을 수 있으며 — 이는 강한 확신을 시사합니다.
이 개념을 기반으로 구축된 지표는 가격이 어디로 갈지 예측하지 않습니다. 대신 주요 수준에서 이미 무슨 일이 일어났는지 이해하도록 도와주어 가격이 돌아올 때 더 나은 결정을 내릴 수 있게 합니다.
---
참고: 이 지표는 직접적인 주문서 데이터가 아닌 틱 거래량과 가격 상호작용을 통해 유동성 역학을 모델링합니다. 틱 거래량은 거래소 거래량이 아닌 브로커 수준 활동을 나타내지만, 상대적 참여 수준을 신뢰성 있게 나타내며 실제 시장 거래량 패턴과 상관관계가 있습니다.
거래에는 위험이 따릅니다. 이 지표는 기술적 분석 도구이며 — 항상 적절한 위험 관리를 적용해야 합니다.


