설명
🚀 차트를 전략적 의사결정 센터로 전환하세요
Smart Tech Analysis는 단순한 지표가 아닙니다.
명확성, 정밀성, 민첩성을 원하는 트레이더를 위해 개발된 완전한 지능형 분석 대시보드입니다.
대부분의 지표가 단편적인 정보만 제공하는 반면, Smart Tech Analysis는 다음을 통합합니다:
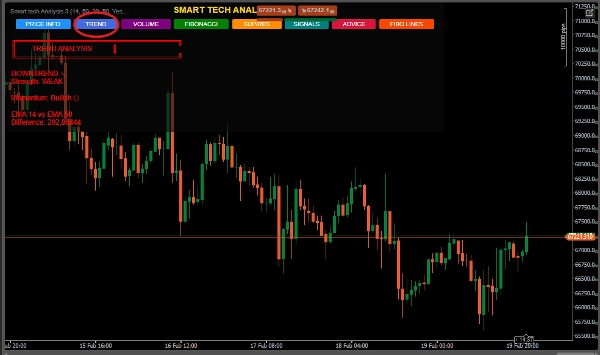
✔ 추세
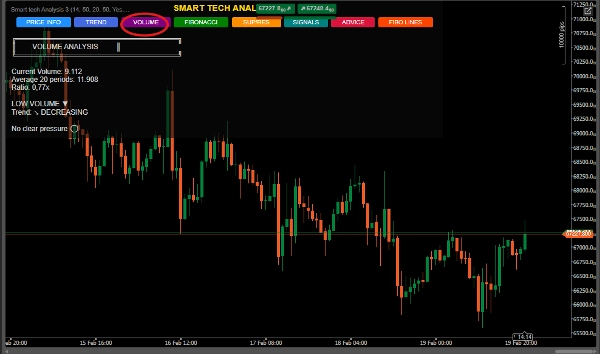
✔ 거래량
✔ 피보나치
✔ 지지 및 저항
✔ 기술 신호
✔ 운영 권고
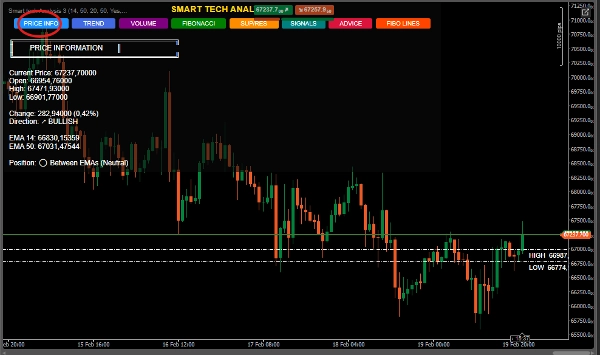
✔ 상세 가격 정보
모두 하나의 동적이고 인터랙티브한 대시보드에 담겨 있습니다.
🔥 큰 차이점
🎯 1. 6-in-1 시스템 – 통합 분석
더 이상 여러 지표를 오가며 볼 필요가 없습니다.
Smart Tech Analysis는 다음을 결합합니다:
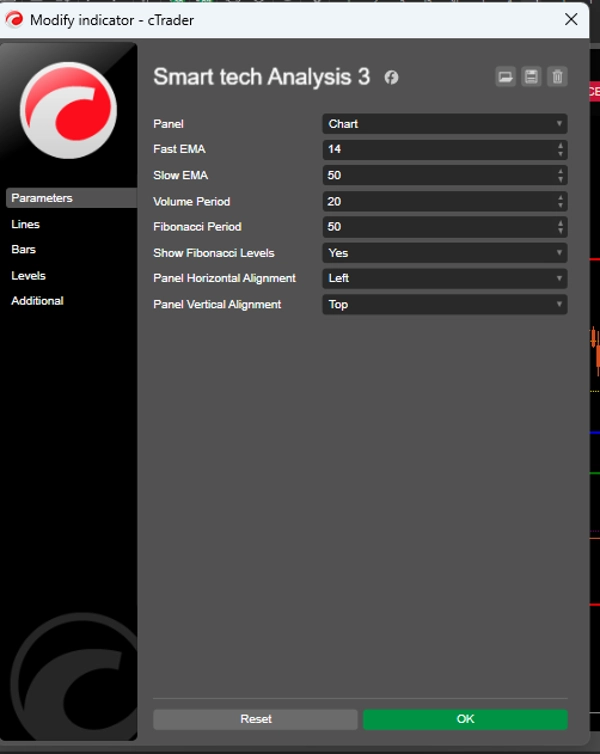
📈 빠른 및 느린 EMA (14 및 50)
📊 비교 분석이 포함된 거래량
🧩 자동 피보나치
🛡 동적 지지 및 저항
🚦 지능형 신호 생성
📌 계산된 스톱 및 목표가 포함된 권고
👉 시각적 잡음을 줄이고 객관성을 높입니다.
🧠 2. 독점 인터랙티브 패널
스마트 버튼이 있는 전문 인터페이스:
가격 정보
추세
거래량
피보나치
지지/저항
신호
조언
트레이더가 보고 싶은 것을 정확히 선택합니다.
📌 조직화.
📌 통제.
📌 전문성.
📈 3. 강도와 모멘텀을 갖춘 추세 분석
단순히 상승 또는 하락을 보여주는 것이 아닙니다.
다음 항목을 계산합니다:
추세 강도
EMA 간 강도 비율
분류: 약함, 보통, 강함
횡보장세에서 약한 진입을 피할 수 있습니다.
📊 4. 기관 매매를 반영한 거래량
시스템은 다음을 식별합니다:
극단적 거래량
매수 또는 매도 압력
가속 또는 감속
과거 평균과의 비교
👉 가능한 기관 활동 탐지에 이상적입니다.
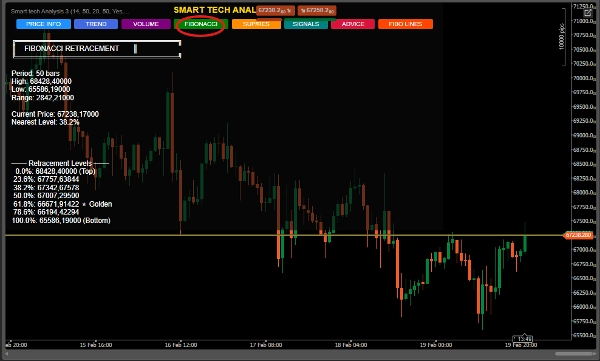
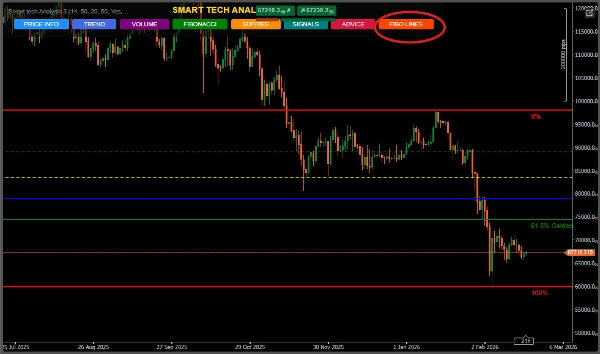
🧩 5. 골든 존을 포함한 자동 피보나치
정의된 기간에 따라 동적으로 계산됩니다.
특별 강조:
⭐ 61.8% 존 (골든 존)
📌 가장 가까운 레벨 식별
📌 강세 및 약세 확장
📌 자동 맥락별 권고
되돌림 트레이더와 스윙 트레이더에게 완벽합니다.
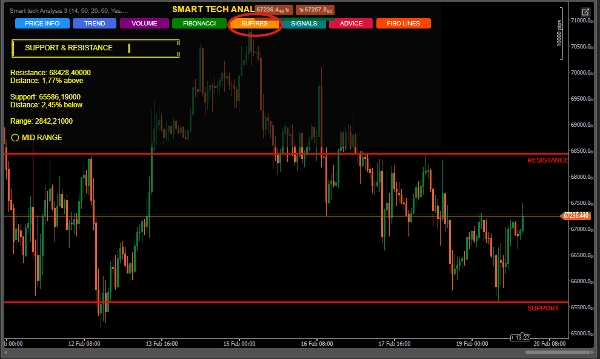
🛡 6. 지능형 지지 및 저항
중요한 고점과 저점을 감지합니다
현재 가격과의 백분율 거리 표시
위치 분류: 지지 근처, 저항 근처, 중간 범위
차트에 자동 선 그리기
전략적 진입 구역에 이상적입니다.
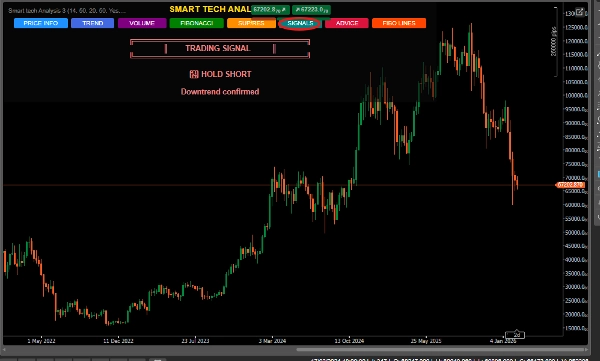
🚦 7. 합류 신호 시스템
알고리즘은 무작위 신호를 생성하지 않습니다.
다음을 결합합니다:
✔ EMA 교차
✔ 지지/저항 근접성
✔ 추세 구조
✔ 가격 맥락
분류:
🟢 강력 매수
🔴 강력 매도
📈 롱 보유
📉 숏 보유
⏸ 대기
표시된 신뢰 수준과 함께.
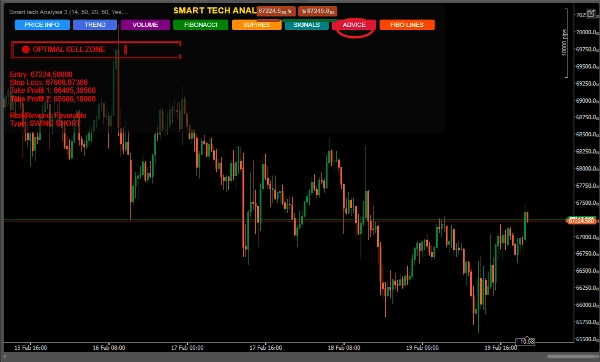
🎯 8. 위험 관리가 포함된 권고
"조언" 패널은 다음을 제공합니다:
추천 진입점
기술적 손절매
두 개의 이익 실현 목표
스윙 구조 (롱 또는 숏)
운영 맥락
👉 단순한 분석이 아닙니다.
👉 구조화된 계획입니다.
🏆 이 지표는 누구를 위한 것인가요?
✔ 명확성이 필요한 초보 트레이더
✔ 합류를 원하는 중급 트레이더
✔ 효율성을 추구하는 고급 트레이더
✔ 스윙 트레이더
✔ 구조적 확인을 사용하는 스캘퍼
💎 시장에서 돋보이는 이유? 일반 지표 Smart Tech Analysis
단편적 정보 통합 분석 시각적 오염 없음 조직화된 대시보드 맥락 없음 기술적 합류 관리 없음 추천된 스톱 및 목표 단순 신호 확인된 신호
📊 직접적인 이점
✔ 감정적 결정을 줄입니다
✔ 정확도를 높입니다
✔ 구조적 읽기를 개선합니다
✔ 시간을 절약합니다
✔ 트레이더의 전문성을 향상시킵니다
🧠 시장 포지셔닝
Smart Tech Analysis는 다음에 이상적입니다:
외환 시장
지수
원자재
암호화폐


