
Penerangan
KST Momentum Heatwave — Tukar Momentum Menjadi Suhu Pasaran (Di Carta)
✅ Enjin KST moden dengan lalai yang dioptimumkan (10/15/20/30 + 10/10/10/15, Isyarat 9)
✅ Lapisan harga sebenar — KST + Isyarat diproyeksikan terus ke carta sekitar EMA garis asas
✅ 4 Mod Visual: Pro Smooth / Klasik / Raw Heat / Dua Tingkat
✅ Peta Panas Momentum + Cahaya untuk memvisualisasikan kekuatan dengan segera
✅ Kekuatan momentum dinormalisasi untuk konsistensi merentas simbol dan jangka masa
✅ Sistem histeresis anti-chop untuk menapis bunyi dalam pasaran mendatar
Ini bukan osilator tradisional.
KST Momentum Heatwave mengubah Know Sure Thing (KST) klasik menjadi sistem suhu momentum visual yang dibina terus pada carta anda.
Daripada menonton osilator di bawah carta, momentum menjadi lapisan dinamik di atas harga — menunjukkan arah, kekuatan, dan kitaran hayat momentum dengan cara yang boleh ditafsirkan dengan segera.
Apa yang indikator lakukan dan untuk apa ia direka
KST Momentum Heatwave menukar data momentum menjadi peta suhu visual tekanan pasaran.
Osilator tradisional memerlukan pedagang sentiasa menukar perhatian antara carta harga dan tetingkap indikator berasingan.
Indikator ini menghapuskan geseran itu dengan memproyeksikan momentum terus ke atas carta harga itu sendiri.
Hasilnya adalah aliran kerja yang lebih bersih di mana anda boleh segera melihat:
- apabila momentum memecut
- apabila trend kuat dan dominan
- apabila momentum menyejuk
- apabila pasaran memasuki chop tenaga rendah
Ia direka untuk pedagang yang ingin mengenal pasti dengan cepat:
- kekuatan trend
- peluang kesinambungan momentum
- keletihan momentum
- peralihan rejim
Daripada meneka sama ada pergerakan mempunyai kuasa di belakangnya, KST Momentum Heatwave menjadikan tekanan itu kelihatan.
Apa yang dipetakan pada carta dan cara membacanya
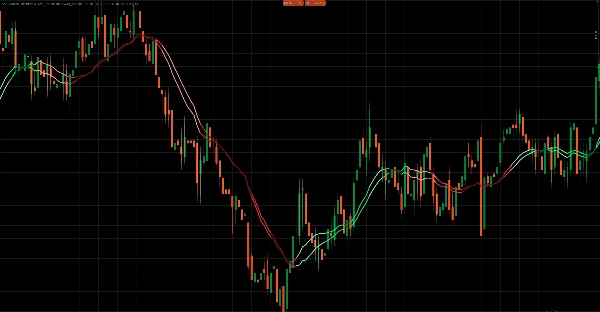
Indikator memetakan dua garis momentum terus pada carta harga, bersama dengan lapisan haba visual.
1. Garis KST — Teras Momentum
Garis momentum utama yang dikira daripada empat komponen ROC berwajaran.
Tafsiran:
- KST di atas Isyarat → momentum menaik
- KST di bawah Isyarat → momentum menurun
Jarak antara dua garis menunjukkan intensiti momentum.
2. Garis Isyarat — Pencetus Momentum
Purata bergerak yang dilicinkan bagi garis KST.
Ia berfungsi sebagai garis pencetus momentum.
- Persilangan antara KST dan Isyarat sering menunjukkan peralihan atau pecutan momentum.
3. Lapisan Haba Momentum
Indikator menukar jarak antara KST dan Isyarat menjadi nilai kekuatan dinormalisasi antara 0 dan 1.
Nilai ini menggerakkan intensiti warna dan visualisasi peta panas.
Tafsiran:
- Warna cerah/terang → momentum kuat
- Warna biasa → tekanan trend stabil
- Warna gelap → momentum melemah
- Warna pudar → potensi perlahan atau peralihan
Kesan peta panas dan cahaya pilihan mengecat lilin itu sendiri, membolehkan pedagang melihat dengan segera apabila pasaran “memanas.”
4. Lapisan Proyeksi Harga
Daripada memplot nilai osilator mentah, indikator memproyeksikan momentum ke harga menggunakan:
- sebuah EMA garis asas
- sebuah amplitud berskala ATR
Ini memastikan lapisan sepadan dengan carta dan memastikan indikator kekal boleh dibaca merentas pasaran dan jangka masa yang berbeza.
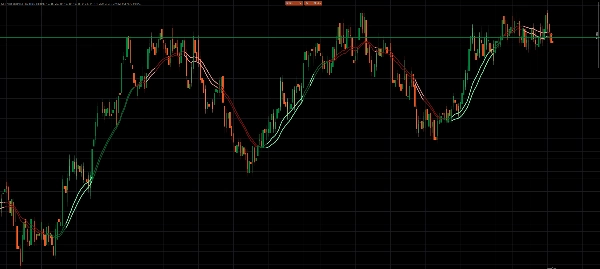
Mod visual dan tingkah laku
KST Momentum Heatwave termasuk empat gaya visual yang mengubah cara momentum ditafsirkan.
Pro Smooth
Mod paling maju.
Ciri-ciri:
- pewarnaan momentum berdasarkan kitaran hayat
- penapisan histeresis
- keperluan pengesahan sebelum arah berubah
Ini mengurangkan bunyi dengan ketara semasa pasaran mendatar atau berombak.
Klasik
Menggunakan pewarnaan kitaran hayat tanpa penapisan histeresis.
Hasil:
- tindak balas momentum lebih pantas
- sedikit lebih sensitif terhadap turun naik pasaran
Sesuai untuk dagangan intrahari dan ayunan.
Raw Heat
Menumpukan sepenuhnya pada kekuatan momentum mutlak.
Momentum dikategorikan kepada tiga tahap:
- kuat
- sederhana
- lemah
Mod ini sesuai untuk pedagang yang mahukan bacaan kuasa momentum tulen.
Dua Tingkat
Mod tafsiran yang dipermudahkan.
- KST di atas/bawah Isyarat menentukan arah
- ambang kekuatan menentukan momentum kuat vs lemah
Direka untuk pedagang yang lebih suka kerumitan visual minimum.
Cara menggunakan KST Momentum Heatwave
Langkah 1 — Pilih mod visual anda
Gunakan mod yang sesuai dengan gaya dagangan anda:
- Pro Smooth → isyarat paling bersih dalam pasaran bising
- Klasik → tindak balas lebih pantas
- Raw Heat → fokus kekuatan momentum
- Dua Tingkat → tafsiran mudah kuat vs lemah
Langkah 2 — Kenal pasti rejim momentum
Cari tingkah laku warna dominan:
- Warna menaik dominan → bias panjang
- Warna menurun dominan → bias pendek
- Warna gelap pudar → momentum melemah
- Perubahan warna kerap → kemungkinan keadaan julat
Langkah 3 — Gunakan momentum untuk masa dagangan
Kes penggunaan tipikal termasuk:
Kesinambungan trend
Masuk semasa pullback apabila rejim momentum kekal utuh dan kekuatan tetap tinggi.
Keletihan momentum
Kurangkan pendedahan apabila warna menjadi lebih gelap dan kekuatan menurun.
Pembalikan momentum
Perhatikan perubahan KST/Isyarat digabungkan dengan peningkatan kekuatan.
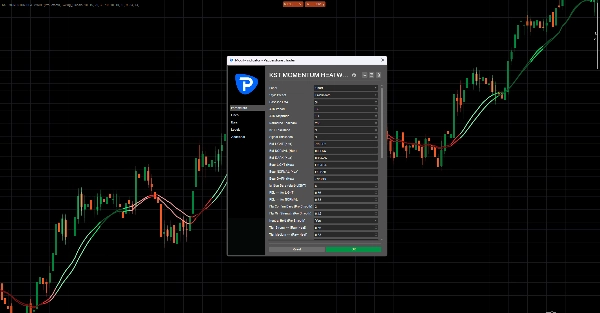
Contoh tetapan yang disyorkan
Konfigurasi seimbang untuk kebanyakan pasaran:
Pratetap: Swing_Classic
Mod Visual: Pro Smooth
EMA Garis Asas: 34
Tempoh ATR: 14
Amplitud ATR: 1.40
Normalisasi Lookback: 200
Peta Panas: Diaktifkan
Cahaya: Diaktifkan
Pasaran dan jangka masa yang disyorkan
Kerana indikator menggunakan penskalaan ATR dan kekuatan dinormalisasi, ia menyesuaikan dengan baik untuk kebanyakan pasaran.
Berfungsi dengan baik terutamanya pada:
Forex
- M5 – H1 untuk dagangan intrahari
- H1 – H4 untuk dagangan ayunan
Indeks
- M1 – M15 untuk scalping momentum
- M15 – H1 untuk dagangan trend berstruktur
Kripto
- M5 – H1 (Pro Smooth disyorkan)
- H1 – H4 untuk persekitaran trend
Komoditi
- M15 – H4
Jangka masa lebih rendah mendapat manfaat paling banyak daripada penapisan Pro Smooth.
Parameter utama dan apa yang dikawalnya
Sistem pratetap
Pratetap Scalp_Clean, Swing_Classic, Smooth, dan Aggressive melaraskan konfigurasi KST dalaman.
Mod khusus membenarkan kawalan manual penuh.
Normalisasi momentum
Normalize Lookback
Mengawal tetingkap sejarah yang digunakan untuk menskala kekuatan momentum.
Nilai lebih tinggi menghasilkan bacaan yang lebih licin.
Proyeksi lapisan
EMA Garis Asas
Menentukan garis sauh yang digunakan untuk memproyeksikan lapisan momentum.
Amplitud ATR
Mengawal sejauh mana lapisan meluaskan dari garis asas.
Kawalan anti-chop (Pro Smooth)
Flip Confirm Bars
Bilangan bar yang diperlukan untuk mengesahkan perubahan rejim.
Flip Min Strength
Kekuatan momentum minimum yang diperlukan sebelum menerima perubahan.
Neutral Hold
Membantu menstabilkan rejim semasa keadaan momentum lemah.
Visualisasi haba dan cahaya
Mengawal seberapa kuat peta panas bertindak balas terhadap kekuatan momentum.
Parameter termasuk:
- Lebar Haba
- Alpha Haba
- Gamma Haba
- Kekuatan Cahaya
Pengurusan prestasi
Keep Bars
Mengehadkan berapa banyak objek visual kekal pada carta untuk memastikan indikator berjalan lancar.
Nota penting
Intensiti objek carta
Kesan peta panas dan cahaya melukis pelbagai objek.
Jika prestasi menjadi perlahan:
- kurangkan KeepBars
- kurangkan Lebar Haba
- nyahaktifkan Cahaya
Ketepuan kekuatan
Lonjakan volatiliti yang melampau mungkin mendorong kekuatan hampir ke maksimum dengan cepat.
Jika ini berlaku:
- tingkatkan Normalize Lookback
- alih ke mod Pro Smooth
Sebaiknya digunakan dengan struktur
KST Momentum Heatwave direka sebagai lapisan rejim momentum, bukan penjana kemasukan berdiri sendiri.
Untuk hasil terbaik gabungkan dengan:
- sokongan dan rintangan
- struktur pasaran
- zon kecairan
- analisis trend


![Logo "Gaussian Channel [Iridio Capital]"](https://cdn.ctrader.com/image/webp/7c039209-5573-4a54-a072-f9528b503103_41960)