
H Capital Liquidity Map Lite V1
지표
254 다운로드
버전 1.0, Mar 2026
Windows, Mac
설명
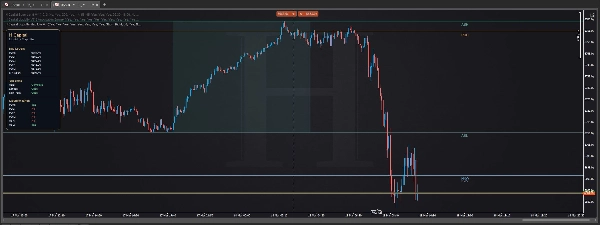
H Capital Liquidity Map Lite는 복잡함 없이 구조를 원하는 트레이더를 위해 설계된 무료 차트 도구입니다.
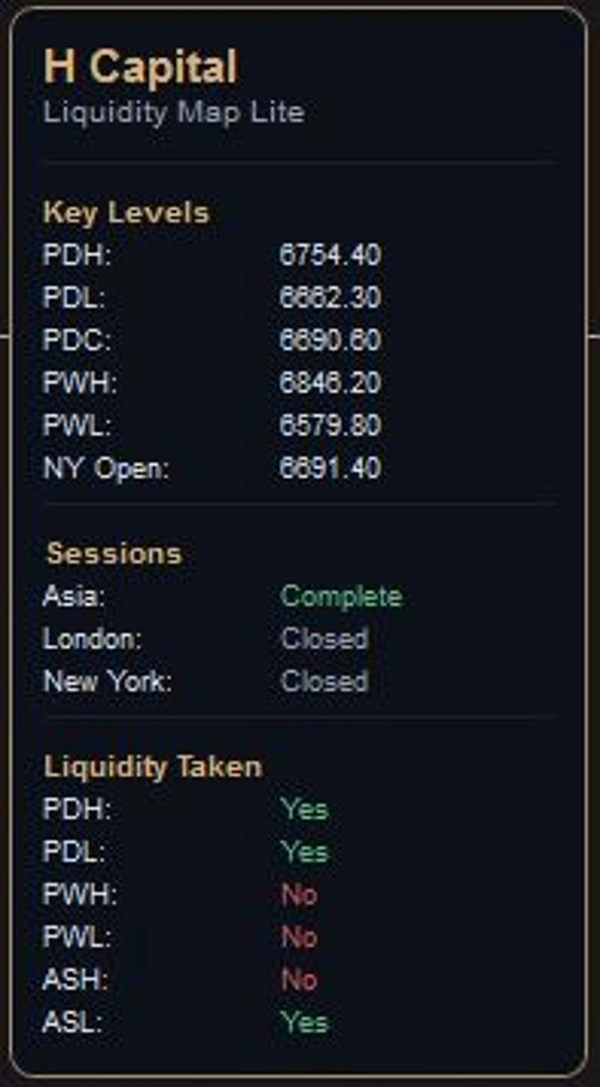
많은 트레이더가 매일 모니터링하는 주요 시장 참조 지점을 표시합니다:
- 전일 고가
- 전일 저가
- 전일 종가
- 전주 고가
- 전주 저가
- 뉴욕 오픈
- 아시아 세션 범위
- 유동성 취득 상태
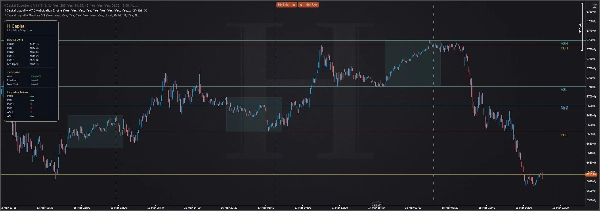
목표는 간단합니다: 실행 전에 트레이더에게 깔끔한 프레임워크를 제공하는 것입니다.
차트를 신호로 가득 채우는 대신, H Capital Liquidity Map Lite는 컨텍스트를 구축하는 데 도움이 되는 수준과 세션 참조에 집중합니다. 인터페이스는 프리미엄 미니멀리스트 스타일로 설계되어 차트는 읽기 쉽고 정보는 한눈에 접근할 수 있도록 유지됩니다.
추천 대상:
- 지수 트레이더
- 외환 트레이더
- 금속 트레이더
- 유동성 기반 트레이더
- 깔끔한 차트를 선호하는 트레이더
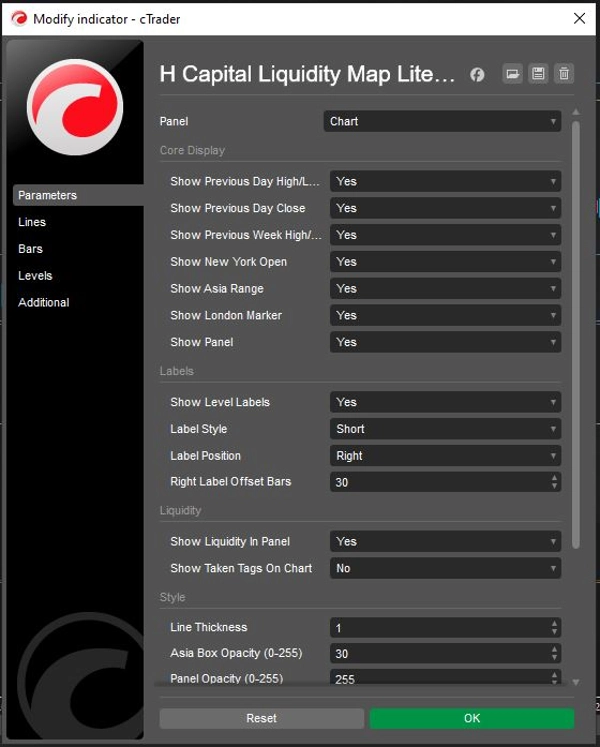
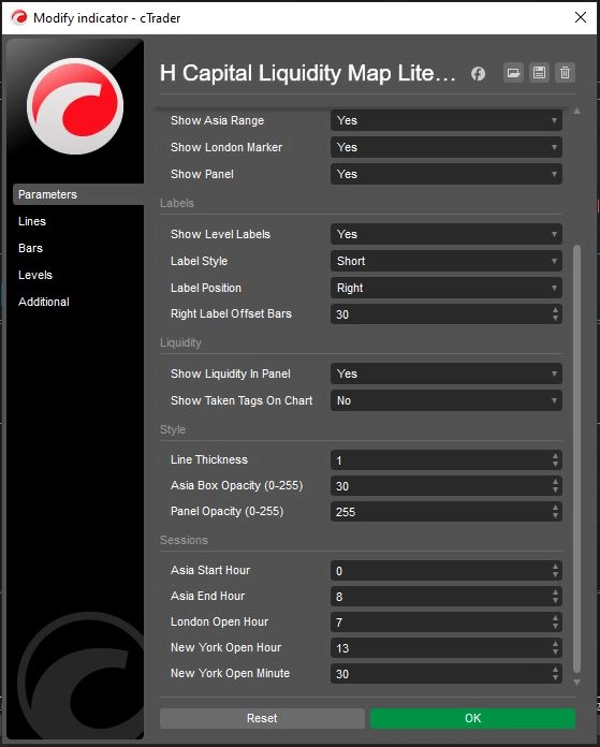
기능:
- 주요 일간 및 주간 유동성 수준을 표시
- 세션 구조를 표시
- 중요 수준이 취득되었는지 추적
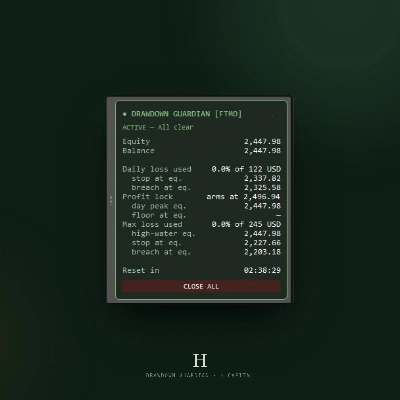
- 프리미엄 온차트 패널을 통해 정보를 체계적으로 유지
하지 않는 것:
- 매수/매도 신호를 생성하지 않음
- 실행 판단을 대체하지 않음
- 알림 엔진으로 작동하지 않음
이것은 신호 도구가 아닙니다. 전문적인 시장 지도입니다.
요약
AI 요약
H Capital Liquidity Map Lite is a charting tool designed to provide traders with a clear, uncluttered view of key daily and weekly liquidity levels. It displays important market references such as the previous day’s high, low, and close; previous week’s high and low; New York open; Asia session range; and liquidity taken status. The tool organizes this information within a minimalist, premium on-chart panel to maintain readability and quick accessibility.
This indicator is suited for traders in indices, forex, metals, and those focusing on liquidity-based strategies who prefer clean chart layouts. It helps build market context by mapping session structures and tracking whether significant levels have been breached. The tool does not generate buy or sell signals, replace execution judgment, or function as an alert system. Instead, it serves as a professional market map to support informed trading decisions.
This indicator is suited for traders in indices, forex, metals, and those focusing on liquidity-based strategies who prefer clean chart layouts. It helps build market context by mapping session structures and tracking whether significant levels have been breached. The tool does not generate buy or sell signals, replace execution judgment, or function as an alert system. Instead, it serves as a professional market map to support informed trading decisions.
지표 프로필
고객 리뷰
0.0
리뷰: 0
고객 리뷰
이 상품에 대한 리뷰가 아직 없습니다. 이미 사용해 보셨나요? 다른 사람들에게 가장 먼저 소개해 주세요!
상담
자주 묻는 질문(FAQ)
Prop
Forex
Indices
Commodities
Crypto
Grid
트레이딩 봇, 지표, 플러그인 등 cTrader Store에서 제공되는 상품은 제3자 개발자에 의해 제공되며, 이는 단순히 정보 및 기술적 접근을 목적으로 제공된 것입니다. cTrader Store는 중개인이 아니며, 투자 조언, 개인별 추천 또는 향후 성과에 대한 어떠한 보장도 제공하지 않습니다.
이 작성자의 상품 더 보기


가격
가입일 09/03/2026
1.58M
거래량
15.43K
핍 수익
254
무료 설치