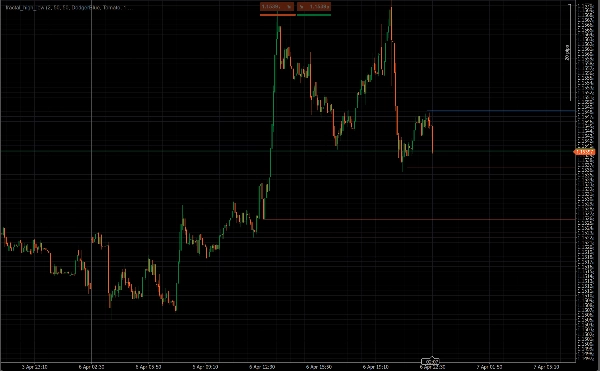
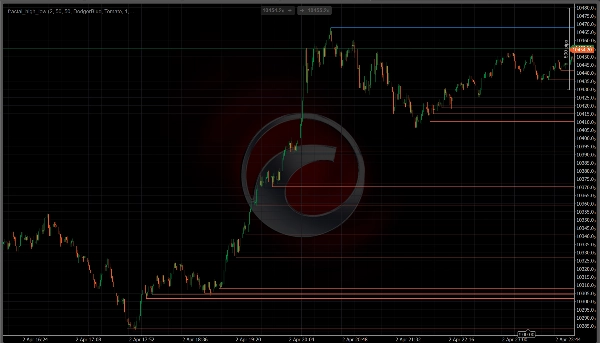
Opis
Jeśli handlujesz na podstawie ruchu cen, już wiesz, że najważniejsze
poziomy na każdym wykresie to fractal highs i lows —
punkty zwrotne, gdzie cena została odrzucona, odwróciła się lub przełamała
strukturę. Frac High Low Lines znajduje te punkty dla Ciebie
i rysuje je automatycznie, dzięki czemu możesz całkowicie skupić się na
czytaniu ceny zamiast zarządzaniu rysunkami.
──────────────────────────────────────────────────────────
JAK TO DZIAŁA
──────────────────────────────────────────────────────────
Wskaźnik wykorzystuje klasyczną logikę fractali Williamsa do potwierdzania
punktów zwrotnych. Fractal high jest ważny tylko wtedy, gdy jego maksimum jest
ściśle wyższe niż otaczające świece po obu stronach. Fractal low jest ważny tylko wtedy, gdy jego minimum jest ściśle niższe.
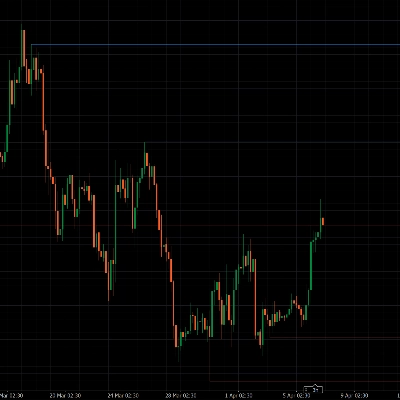
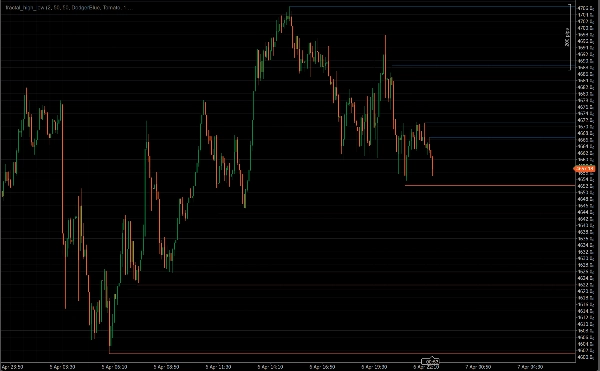
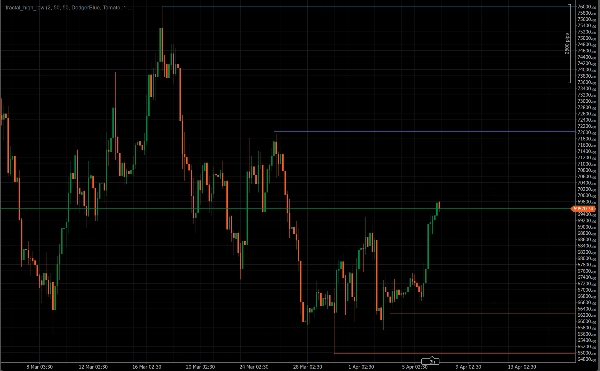
Po potwierdzeniu rysowana jest pozioma linia od tego punktu zwrotnego
i przedłużana do przodu — dając wyraźne odniesienie wizualne
dla każdego istotnego poziomu strukturalnego na wykresie.
Brak przerysowywania. Fractale są potwierdzane dopiero po zamknięciu wystarczającej liczby świec
po obu stronach, więc poziomy nigdy nie pojawiają się i
nie znikają w miarę ruchu ceny.
──────────────────────────────────────────────────────────
KLUCZOWE CECHY
──────────────────────────────────────────────────────────
• Automatyczne wykrywanie fractali — skanuje wszystkie świece przy ładowaniu, a następnie
aktualizuje w czasie rzeczywistym w miarę powstawania nowych świec
• Konfigurowalny okres fractala — użyj okresu 2 dla każdego
drobnego zwrotu, lub zwiększ go, aby wyodrębnić tylko główne
strukturalne maksima i minima
• Kontrola maksymalnej liczby linii — niezależne ograniczenie liczby
linii oporu i wsparcia wyświetlanych jednocześnie, utrzymując wykres
czystym i skupionym na ostatniej strukturze
• Usuwanie przełamanych poziomów — opcjonalnie automatycznie usuwa linię
gdy cena zamknie się przez nią, tak aby widoczne pozostały tylko nieprzełamane poziomy
• Pełna kontrola wizualna — ustaw kolor, grubość i styl linii (Solid, Dash, Dot) niezależnie dla maksimów i minimów
• Lekki — każda linia jest rysowana raz i nigdy nie jest przerysowywana,
więc wydajność pozostaje płynna nawet na wykresach M1 lub M5
──────────────────────────────────────────────────────────
DLA KOGO JEST TEN WSKAŹNIK
──────────────────────────────────────────────────────────
Stworzony specjalnie dla traderów price action, którzy używają swingowych
maksimów i minimów do identyfikacji struktury, planowania wejść w transakcje,
ustawiania stop lossów oraz wykrywania potencjalnych stref odwrócenia lub wybicia.
Działa na każdym symbolu i na dowolnym interwale czasowym w cTrader.
──────────────────────────────────────────────────────────
ZA DARMO — BEZ ŻADNYCH ZOBOWIĄZAŃ
──────────────────────────────────────────────────────────
Frac High Low Lines jest całkowicie darmowy. Zainstaluj go, dodaj
do swojego wykresu i handluj z czyściejszymi poziomami struktury od
pierwszej sesji.
==========================================================
Podsumowanie
The indicator updates in real time as new bars form and scans all bars on load. It offers configurable fractal periods to capture minor or major swings, controls to limit the number of displayed lines for clarity, and an option to automatically remove lines when price closes through them. Users can customize line color, thickness, and style independently for highs and lows. The indicator is lightweight, drawing each line once to maintain smooth performance even on low timeframes like M1 or M5.
fractal_high_low works on any symbol and timeframe within the cTrader platform and supports markets including Forex, stocks, commodities, indices, and cryptocurrencies. It aids traders in identifying market structure, planning entries, setting stops, and spotting reversal or breakout zones.