present
가입하고 첫 구매 시 $50 할인을 받으세요
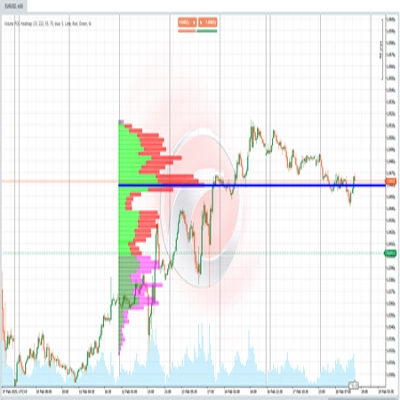
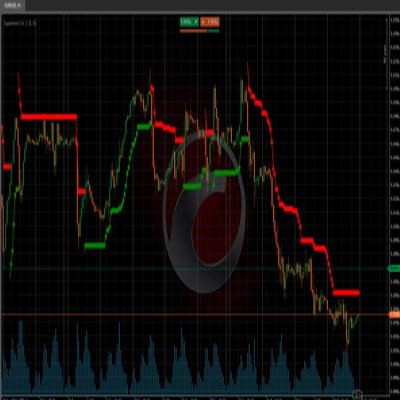
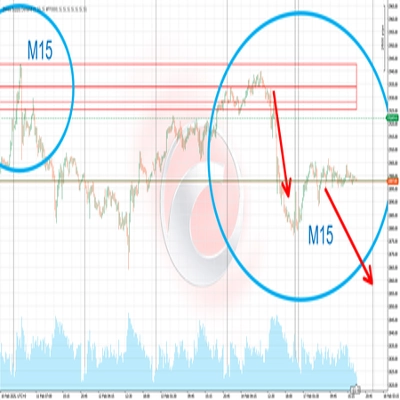
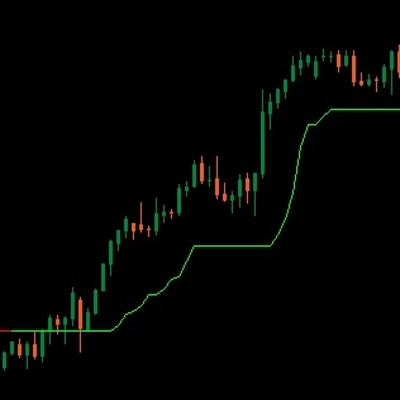
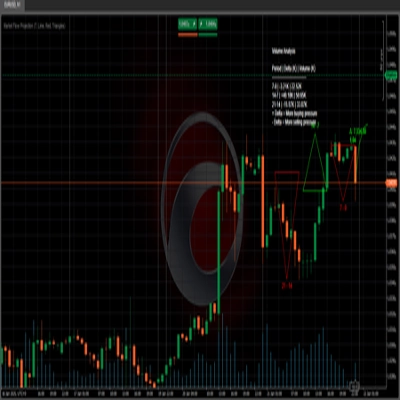
Trading product for Market Flow Projection 지표 Supertrend RSI, image 1
Market Flow Projection
지표
버전 1.0, Jan 2025
Windows, Mac
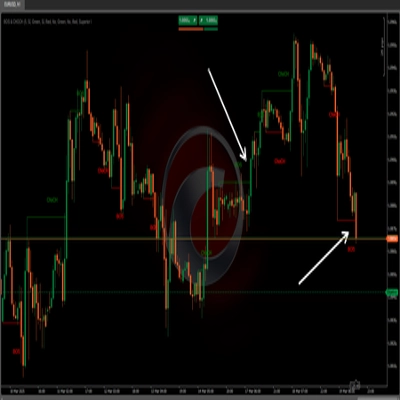
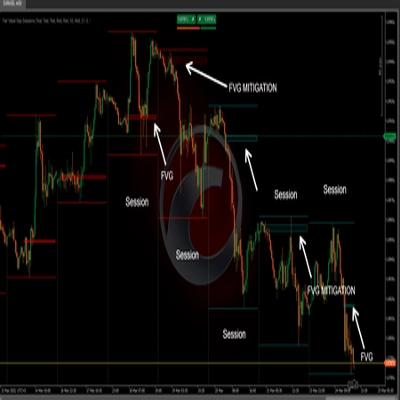
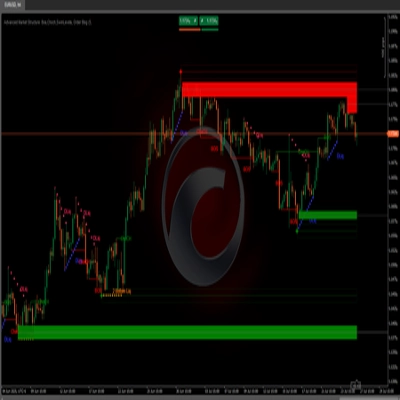
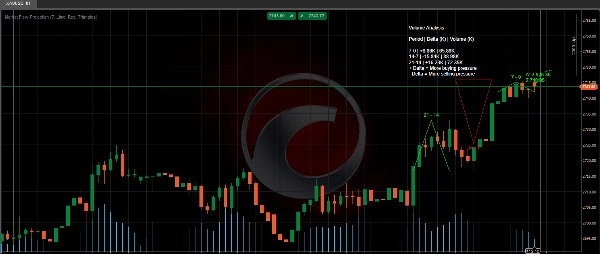
Trading product for Market Flow Projection 지표 Supertrend RSI, image 2
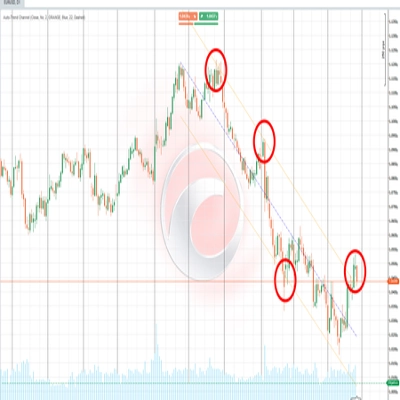
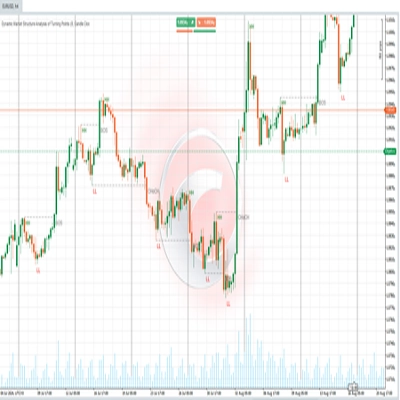
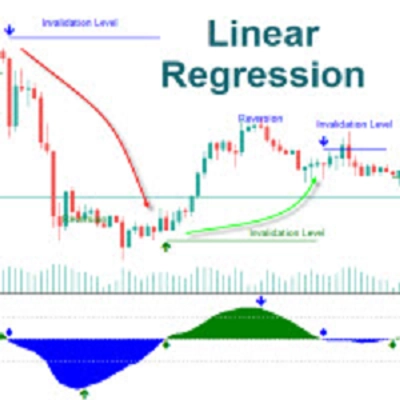
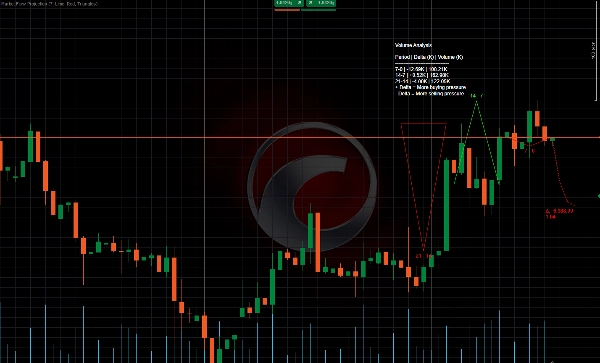
Trading product for Market Flow Projection 지표 Supertrend RSI, image 3
가입일 03/10/2024
177
판매
45.32K
무료 설치

설명

요약

AI summary
Market Flow Projection is an indicator that analyzes price and delta volume data across three consecutive periods to identify dominant market trends and shifts. It calculates average highs, lows, and the difference between buying and selling pressure, consolidating historical movements for clearer trend analysis. The indicator projects a future trendline based on a weighted average of delta volumes, dynamically adjusted with smoothing factors to moderate extreme predictions. Visual elements include geometric shapes—such as triangles, circles, and boxes—that represent volume and price range evolution for each period, with color coding to indicate bullish or bearish trends. A label at the end of the projected trendline displays the average delta volume and estimated future price, providing a reference for potential price movements and trend strength. Additionally, a detailed volume data table breaks down total volumes and delta differences for the analyzed periods, supporting market context interpretation and trend projection. By integrating volume and price data, Market Flow Projection offers a tool for anticipating market direction and assessing trend strength.
지표 프로필

고객 리뷰

0.0
리뷰: 0
고객 리뷰
이 상품에 대한 리뷰가 아직 없습니다. 이미 사용해 보셨나요? 다른 사람들에게 가장 먼저 소개해 주세요!

상담

자주 묻는 질문(FAQ)

Supertrend
RSI
트레이딩 봇, 지표, 플러그인 등 cTrader Store에서 제공되는 상품은 제3자 개발자에 의해 제공되며, 이는 단순히 정보 및 기술적 접근을 목적으로 제공된 것입니다. cTrader Store는 중개인이 아니며, 투자 조언, 개인별 추천 또는 향후 성과에 대한 어떠한 보장도 제공하지 않습니다.

이 작성자의 상품 더 보기

"ZigZag" 로고
최고 평점
4.3
(6)
무료
지표
ATR
RSI
+7
ZigZag filters noise, spots trends, patterns, pivots, aiding analysis, trade management, and confirmations. 📉📈
지표
ATR
RSI
+7
Identify bullish and bearish Order Blocks to spot key support/resistance levels and potential trend reversals! 📈🔄
지표
ATR
RSI
+7
📊 Shows volume by price levels, highlights POC, and key zones. Identifies dynamic support/resistance and imbalances.
지표
ATR
RSI
+6
Market structural patterns , specifically the concepts of Change of Character (ChoCH) 🔄 and Break of Structure (BoS) 💥
지표
ATR
RSI
+6
Adaptive trend channel using linear regression and Pearson correlation for dynamic support, resistance, and trends.
지표
RSI
Breakout
+1
"Identify key market zones and visualize support/resistance from multiple timeframes on a single chart.
멀티플랫폼 플러그인
Economic Calendar
Displays live economic events directly inside your cTrader charts.
지표
ATR
RSI
+6
💹 Define a price channel 📈 and determine trend direction (bullish 🟢 or bearish 🔴).
지표
ATR
RSI
+7
identify and highlight temporary market inefficiencies known as "fair value gaps" 🚨 within specific trading Sessions.
지표
RSI
BTCUSD
+5
Identify market structure effortlessly with swing highs, lows, CHoCH, and BOS levels for smart trading decisions! 📊🔍"
지표
ATR
RSI
+6
📊Zones Supply & Demand: Identifies key price levels with high volume concentration, marking Supply/Demand Zones & Marke
지표
Advanced price action tool that combines multiple technical analysis concepts

좋아하실 만한 다른 항목

지표
Forex
BTCUSD
+4
The Linear Regression Oscillator (LRO) is a technical indicator based on linear regression analysis.
지표
Fisher Transform with smoothing. Spot reversals and cycles with precision. Great for any market, any timeframe.
지표
Clean trend indicator using CCI & ATR. Highlights up/down trends with adaptive, no-repaint lines.
지표
Forex
Crypto
+5
Automatically plots Fibonacci retracement levels using the highest and lowest points of a customizable time range
지표
Forex
Detects valid Fair Value Gaps from strong 3-bar patterns. Keep drawing unfilled gaps until price fills them.
지표
Prop
Forex
+2
⚔️ JPY Samurai Breakout Pro — Professional Breakout Indicator for cTrader ⚔️
지표
Prop
Forex
+7
The Parabolic SAR, or "Stop and Reverse," is a dynamic technical analysis tool.
지표
Highlights market sessions & overlaps with real-time range & volume stats – perfect for pro scalpers.
지표
Pin Bar
Inducement
+5
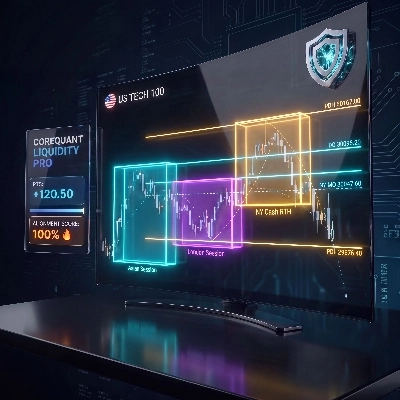
Institutional Nasdaq Session Liquidity Map with Live Point HUD, Sweep Alerts & Interactive Playbook.
지표
Prop
Forex
+10
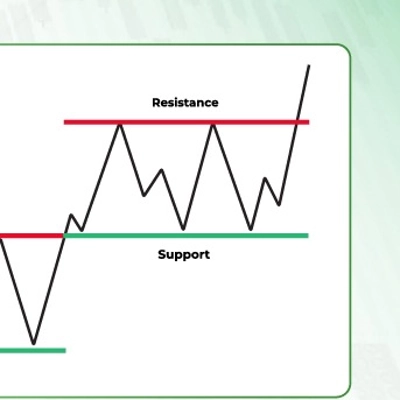
Support and Resistance Line Indicator with Higher Timeframe Filter
지표
Aggressive
Supertrend
+5
Stop trading with tunnel vision! 🚫 The Heat Map Dashboard is an institutional-grade visual trading assistant
지표
Prop
Forex
+4
The Smooth Heiken Ashi indicator is a refined charting tool designed to filter out market noise and highlight true price
지표
Imbalance
Inside Bar
+3
A clean and powerful Smart Money Concepts tool combining Fair Value Gaps, Previous Daily High/Low, Inside/Outside bar
지표
RSI
RSI on the main chart with 45/55 momentum levels, overbought/oversold levels, averaged RSI, and multi-timeframe support.
지표
ADX
ATR
+5
Configure, simulate, and analyze trading strategies with custom filters, multi-target exits, and detailed performance me
지표
BOS
Fibonacci
+4
Automatically draws major trading sessions, killzones, and SMC daily liquidity targets directly on your cTrader charts.
지표
ATR
Wedge
+2
Strong Supertrend Turn Market Movement into a Clear Map Market analysis
지표
Drawdown Monitor
Protect your funded account. Real-time Daily Equity Drawdown monitor with Green / Orange / Red flashing alerts.

가격

가입일 03/10/2024
177
판매
45.32K
무료 설치