
present
Registrati e ricevi uno sconto da $50 sul tuo primo acquisto
Trading product for EMA cBot Strategy Indicator Indicatore EMA Ichimoku, image 1
EMA cBot Strategy Indicator
Indicatore
Versione 1.0, Jun 2026
Windows, Mac
Trading product for EMA cBot Strategy Indicator Indicatore EMA Ichimoku, image 2
Trading product for EMA cBot Strategy Indicator Indicatore EMA Ichimoku, image 3
Trading product for EMA cBot Strategy Indicator Indicatore EMA Ichimoku, image 4
Trading product for EMA cBot Strategy Indicator Indicatore EMA Ichimoku, image 5
Trading product for EMA cBot Strategy Indicator Indicatore EMA Ichimoku, image 6
Trading product for EMA cBot Strategy Indicator Indicatore EMA Ichimoku, image 7
Trading product for EMA cBot Strategy Indicator Indicatore EMA Ichimoku, image 8
Trading product for EMA cBot Strategy Indicator Indicatore EMA Ichimoku, image 9
Trading product for EMA cBot Strategy Indicator Indicatore EMA Ichimoku, image 10
30
Vendite
916
Installazioni gratuite

Descrizione

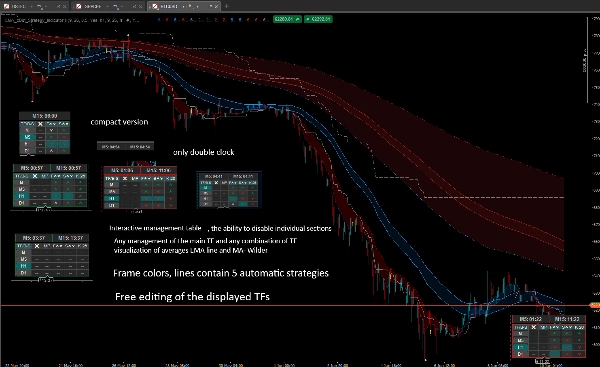
La Dashboard definitiva per Trend e Momentum Multi-Timeframe (MTF) è una suite analitica avanzata progettata per eliminare il "disordine del grafico" fornendoti al contempo un contesto di mercato di livello istituzionale. Aggregando dati critici da più timeframe in un pannello interattivo elegante e integrato nel grafico, ti permette di prendere decisioni di trading più velocemente e con maggiore fiducia. Che tu sia uno scalper su timeframe inferiori o un trader swing giornaliero, questo strumento offre intuizioni precise sulla forza del trend, potenziali ritracciamenti e livelli strutturali chiave Indicatore progettato per entrare in operazioni semi-automatiche manualmente o con un bot https://ctrader.com/products/3618

Qualsiasi possibilità di mostrare TF e qualsiasi combinazione di TF delle medie mostrate - diversa dall'attuale TF su cTrader

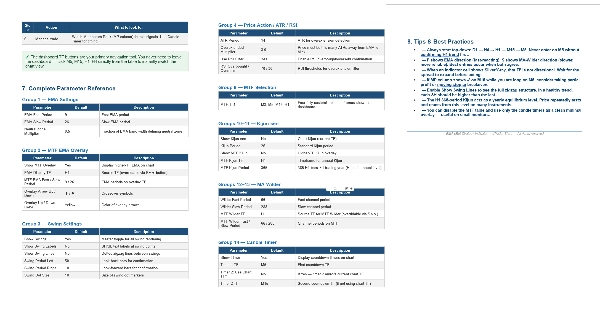
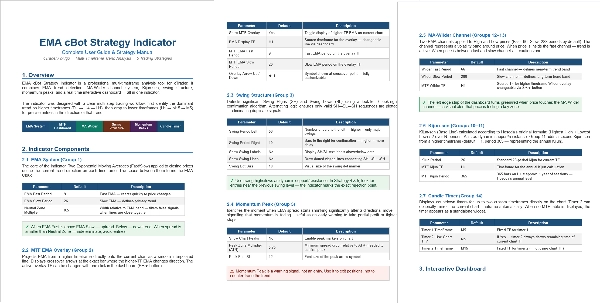
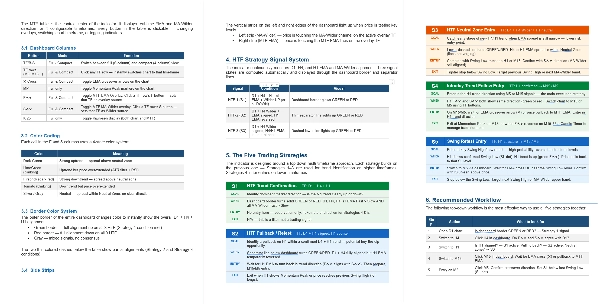
Guida - https://clogic-algo.github.io/EMA_cBot_Strategy_Guide/EMA_Strategy_Guide.html

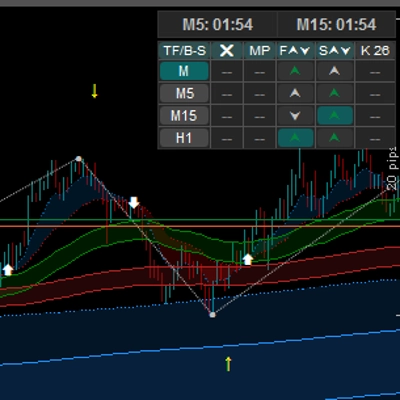
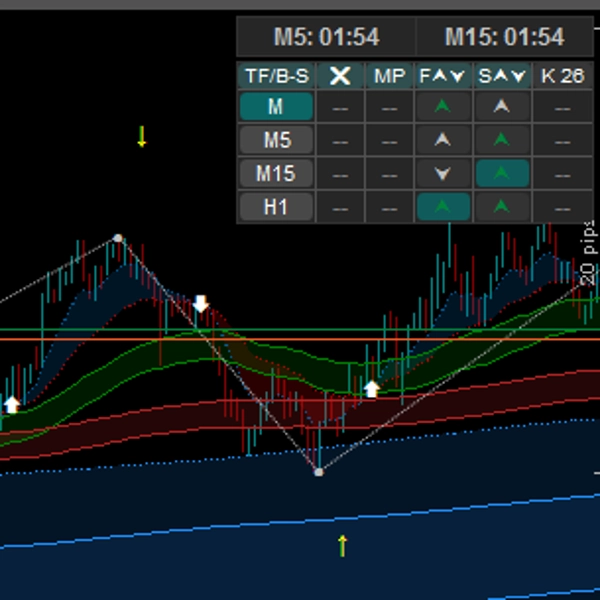
1. Dashboard Interattiva Multi-Timeframe (MTF)

  • Monitora fino a 4 Timeframe (ad esempio, M1, M5, H1, D1) simultaneamente all'interno di un pannello UI pulito.
  • UI cliccabile: Cambia istantaneamente il timeframe del tuo grafico semplicemente cliccando i pulsanti sulla dashboard!
  • Modalità Compatta / Completa: Alterna la dimensione della dashboard per mostrare o nascondere metriche avanzate (segnali EMA, Wilder, Kijun e Momentum) per risparmiare spazio sullo schermo.
  • Bordo di Allineamento HTF: Il bordo della dashboard cambia dinamicamente colore per avvisarti quando i Timeframe Superiori (H1, H4, D1) sono completamente allineati.

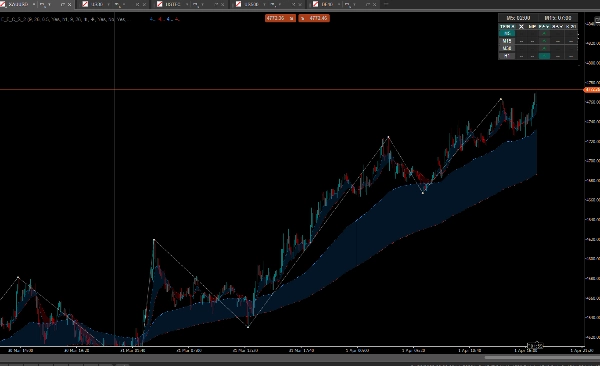
2. Struttura di Mercato Automatizzata (Swing High / Swing Low)

  • Identifica e marca automaticamente i punti di svolta (Swing Highs / Lows) con punti visivi ed etichette di testo.
  • Opzionalmente disegna linee Swing (stile Zig-Zag) per visualizzare facilmente le onde di mercato e le rotture della struttura di mercato.
  • Controllo completo sulla sensibilità dello swing (periodi di lookback regolabili a sinistra/destra delle barre).

3. Medie Mobili Avanzate e Nuvole di Trend

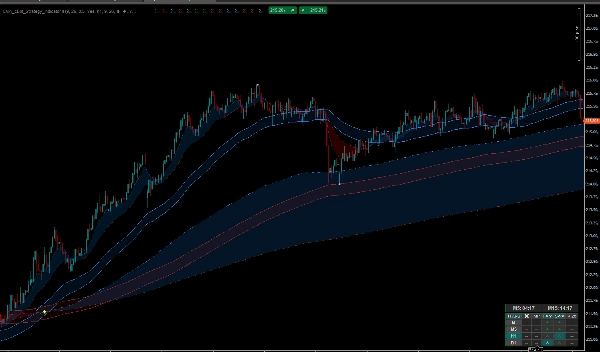
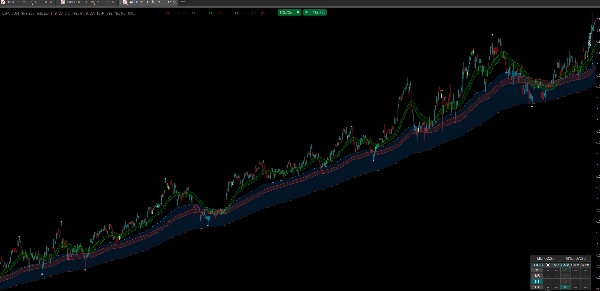
  • Visualizza la direzione del trend usando "Nuvole" trasparenti tracciate tra Medie Mobili Veloci e Lente (EMA e MA-Wilder).
  • Sovrapposizioni MTF Vere: Traccia le EMA di timeframe superiori (ad esempio, EMA a 1 ora) direttamente sul tuo grafico a timeframe inferiore corrente (ad esempio, 5 minuti) in modo fluido e senza distorsioni.
  • Frecce visive integrate e avvisi per incroci EMA.

4. Esaurimento del Trend e Picchi di Momentum

  • Utilizza un algoritmo intelligente combinato con filtri ATR e RSI per rilevare quando il prezzo è fortemente esteso.
  • Picchi di Momentum: L'indicatore analizza lo "spread" tra medie veloci e lente. Quando una forte spinta di momentum termina e le medie iniziano a contrarsi, stampa una freccia di avviso "Picco" specifica—un eccellente strumento per individuare ritracciamenti e zone di take-profit.

5. Supporto Ichimoku (Kijun-sen)

  • Attiva una classica linea Kijun-sen per agire come supporto/resistenza dinamico.
  • Include un'opzione MTF Kijun per visualizzare la linea base da un timeframe superiore sul tuo grafico corrente.

6. Strisce di Stato Edge e Timer Doppio per Candele

  • Strisce "Edge" discrete e codificate a colori (trattini) accanto alla dashboard ti danno una lettura visiva immediata del bias di trend dei timeframe superiori, assicurandoti di non operare contro il trend macro.
  • Timer di conto alla rovescia doppio integrato che mostra il tempo rimanente per la candela corrente E una candela di timeframe superiore (ad esempio, M5 e H1) simultaneamente.

⚙️ Personalizzazione Ultima:

Questo indicatore è stato costruito per adattarsi alla tua strategia. Hai il pieno controllo su:

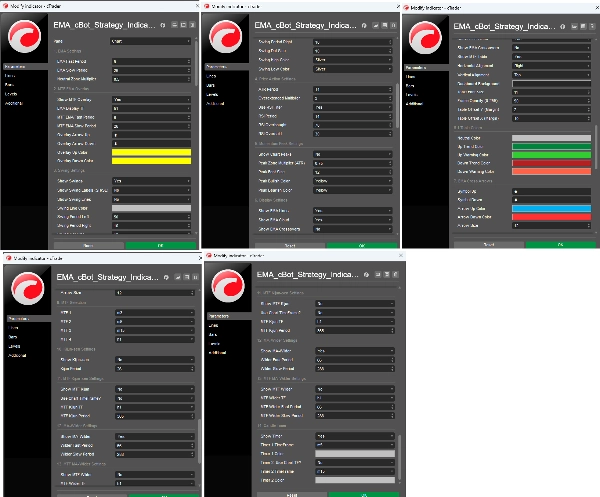
  • Periodi e parametri per tutte le Medie Mobili (EMA, Wilder, Kijun).
  • Personalizzazione completa dei colori UI (nuvole, sfondo pannello, testo, avvisi di trend).
  • Posizionamento della dashboard (Sinistra/Destra, Alto/Basso), margini e opacità.
  • Soglie dei filtri ATR e RSI per eliminare falsi segnali.

Per chi è questo indicatore?

  • Follower del Trend che cercano di allineare le loro entrate con il momentum di timeframe superiori.
  • Trader di Price Action che si affidano a una struttura di mercato Swing High/Low accurata.
  • Daytrader e Scalper che necessitano di una lettura costante dei trend H1/H4/D1 senza ingombrare il loro spazio di lavoro con molteplici finestre.

Ottimizza il tuo spazio sullo schermo e ottieni un enorme vantaggio con un vero contesto Multi-Timeframe. Installa la dashboard oggi e adattala perfettamente al tuo stile di trading!

Riepilogo

Riepilogo AI
The EMA cBot Strategy Indicator is an advanced multi-timeframe (MTF) dashboard designed for trend and momentum analysis on the cTrader platform. It consolidates key market data from up to four timeframes (e.g., M1, M5, H1, D1) into a compact, interactive panel that enables quick timeframe switching and customizable display modes. The indicator automatically identifies market structure turning points (Swing Highs/Lows) and optionally draws zig-zag swing lines to visualize market waves.

Key features include visualization of trend direction through transparent clouds between fast and slow moving averages (EMA and Wilder MA), true MTF overlays that plot higher timeframe EMAs on lower timeframe charts without distortion, and built-in alerts for EMA crossovers. It incorporates a smart algorithm with ATR and RSI filters to detect trend exhaustion and momentum peaks, signaling potential pullbacks or take-profit zones.

The indicator also supports Ichimoku Kijun-sen lines as dynamic support/resistance, with multi-timeframe options. Additional tools include color-coded edge status strips indicating higher timeframe trend bias and a dual candle countdown timer for current and higher timeframe candles.

Users have full customization over moving average parameters, UI colors, dashboard positioning, and filter thresholds. This tool suits trend followers, price action traders, day traders, and scalpers seeking institutional-grade multi-timeframe market context in a streamlined interface.
Profilo indicatore
Categoria indicatore
Trend
Tipo di output
Visualizzazione
Segnali
Filtro
Requisiti per i dati
Solo barre
Segnali supportati
Superamento
Forza del trend

Recensioni dei clienti

0.0
Recensioni: 0
Recensioni dei clienti
Questo prodotto non ha ancora ricevuto recensioni. L'hai già provato? Fallo sapere agli altri per primo!

Discussioni

Domande frequenti

EMA
Ichimoku
Market Structure
ATR
I prodotti disponibili tramite cTrader Store, inclusi bot di trading, indicatori e plugin, sono forniti da sviluppatori terzi e resi disponibili esclusivamente a scopo informativo e di accesso tecnico. cTrader Store non è un broker e non fornisce consulenze in materia di investimento, raccomandazioni individualizzate o garanzie di risultati futuri.

Altro da questo autore

Indicatore
AI
Prop
+8
The EMA Trend Simple is a trend-following tool designed for simplicity and visual clarity.
cBot
Prop Firm Fit
Stop Loss (SL) Manager
+1
HTS Strategy Tester - Advanced Multi-Timeframe Trend & Pullback Trading System H1/m1 & H4/m5 WWS 33/144 Start from 100$
90.1%
ROI
2.92
Fattore di profitto
Indicatore
AI
Grid
+7
Follow The Trend cBot - INDICATOR - displays two Moving Average Bands for cBot or for your own use
Indicatore
ATR
MACD
+15
MACD Advanced -- It combines the standard MACD logic with a rich set of visual tools
Indicatore
ATR
Prop
+13
HCCC MTF (Hurst Cycle Composite Channel), Designed for Semi-Automated Trading, Interactive MTF Dashboard
Indicatore
AI
SMC
+7
The ultimate tool for Price Action and ICT. High, Low and Mid levels for days, weeks Inc. NY Midnight and Custom Range.
Indicatore
Key Levels
TP_SL Very useful Risk & Reward Tool. Bring the ultimate TradingView-style Long/Short Position
Indicatore
AI
SMC
+4
Weekly Daily Opening Gaps — NWOG & NDOG Indicator Professional-grade opening gap visualization for institutional traders
Indicatore
AI
Prop
+7
EMA Clouds, Multi-Timeframe (MTF) Overlay, Swing High/Low detection, and a smart Dashboard with neutral zone filtering.
Indicatore
ATR
Channel
+1
Bollinger Bands Advanced Squeeze & Breakout System, Real-Time On-Chart Dashboard, Auto-Squeeze Detector, Dual-Band Cloud
Indicatore
AI
RSI
+7
EMA MTF TREND PRO - Multi-timeframe trend analysis overlay indicator, 6 timeframes - in one table with ADX
Logo di "RSI Advanced"
Più votato
5.0
(4)
$20
/
$30
Indicatore
AI
ATR
+12
The standard Relative Strength Index (RSI), RSI & Signal Cloud, Smart Volatility Filter (ATR), On-Chart Info Dashboard

Potrebbe interessarti anche

Indicatore
CHOCH
Inducement
+5
TradeLens - Frame the Trade. Refine the Entry. Two Timeframes. One Decision.
Indicatore
Prop
Forex
+12
⚡ ADXVMA Aurora Trend Filter combines ADX trend strength with an adaptive EMA blend ⚡
Indicatore
Smart Signal Reversal Trend + Patterns
Indicatore
Prop
ZigZag
+5
All-in-One ICT/SMC Institutional Framework — Ranges, Structure, Liquidity, Fibonacci & Time Engine.
Indicatore
ATR
SMC
+18
Precision SMC tool with HTF sweeps, MSS confirmation & smart FVG detection for high-probability reversals.
Indicatore
BOS
VWAP
+4
Gold premiun XAUUSD Exclusive Real-Time Adaptive Intelligence
Indicatore
ATR
BOS
+5
Know how strong each Supertrend flip is: scored BUY/SELL, structure stop + 3 targets, live win-rate dashboard, alerts.
Indicatore
Prop
Forex
+13
"Footprint Chart: Visualize bid-ask volume inside candles for clearer order flow and market depth insights."
Indicatore
ADX
ATR
+5
Ten confluence layers scored on every closed bar, with an anti-chop gate, pivot levels and a live dashboard.
Indicatore
VWAP
Volume
+3
Track hidden trading activities to be on the right side of the market.
Indicatore
Double Top
Key Levels
+5
Indicator acts as a dynamic target identification engine based on SMC and ICT. Detects HTF Bias and Confluence liquidity
Indicatore
ATR
SMC
+19
Smart Liquidity Sweep detector with auto-drawing True Channels and real market structure mapping.
Indicatore
SMC
Prop
+5
VA Footprint replaces your chart with a order flow one, the most precise way to read the market.
Indicatore
Forex
EURUSD
+7
Institutional Session Levels Pro OHLC,Prev(D,W,M OHLC)
Indicatore
Forex
EURUSD
+5
The Smart Money Concepts indicator is an all-in-one overlay tool that automatically detects OB, FVG ecc..
Indicatore
Aggressive
Supertrend
+5
Stop trading with tunnel vision! 🚫 The Heat Map Dashboard is an institutional-grade visual trading assistant
Indicatore
Key Levels
Liquidity Sweep
+2
Complete intraday market structure tool tracking session killzones, Asian range projections, and PDH/PDL levels.
Indicatore
AI
ATR
+26
SR Commander — Multi Timeframe Edition. See where the big money draws the line. Trade on your timeframe. Think on theirs

Prezzo

30
Vendite
916
Installazioni gratuite




























