present
Daftar dan dapatkan potongan bernilai $50 untuk pembelian pertama anda
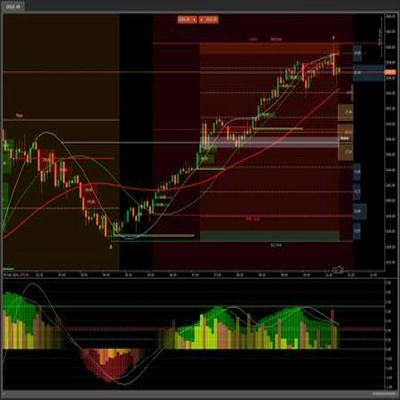
Trading product for EMA_RTH Indikator, image 1
EMA_RTH
Sejak 19/05/2025
82
Pemasangan percuma

Penerangan

EMA dikira pada tempoh/sesi tersuai pilihan anda

Ringkasan

Ringkasan AI
EMA_RTH is a technical indicator that calculates the Exponential Moving Average (EMA) based on a custom period or trading session defined by the user. This flexibility allows traders to tailor the EMA calculation to specific market hours or timeframes relevant to their trading strategy. The indicator focuses on providing EMA values derived from user-selected sessions rather than standard fixed periods, enabling more precise analysis aligned with particular trading sessions.
Profil indikator

Perbincangan

Ulasan pelanggan

0.0
Ulasan: 0
Ulasan pelanggan
Belum ada ulasan untuk produk ini. Anda sudah mencuba produk tersebut? Jadilah yang pertama untuk berkongsi pendapat anda!

Soalan Lazim

Produk yang tersedia melalui cTrader Store, termasuk bot dagangan, indikator dan plugin, disediakan oleh pembangun pihak ketiga dan diberikan akses untuk tujuan maklumat dan teknikal sahaja. cTrader Store bukan broker dan tidak memberikan nasihat pelaburan, syor peribadi atau sebarang jaminan prestasi masa hadapan.

Lebih banyak produk daripada penulis ini
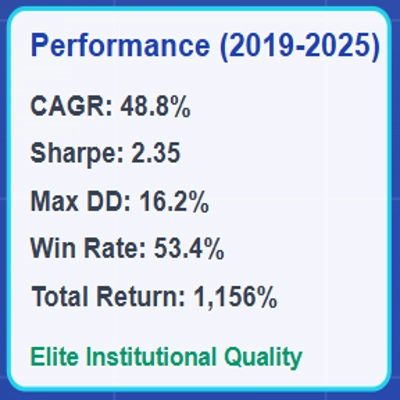
NAS100 Gap-and-Go is an institutional-quality systematic trading algorithm that identifies and trades gap continuation

Anda juga mungkin suka

😎Read the description before purchasing💩
Traders Dynamic Index (TDI) — Divergence Edition
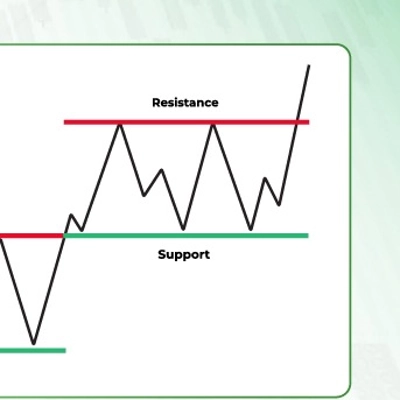
Support and resistance from a rolling volume profile, ranked by strength or recency, updated live.
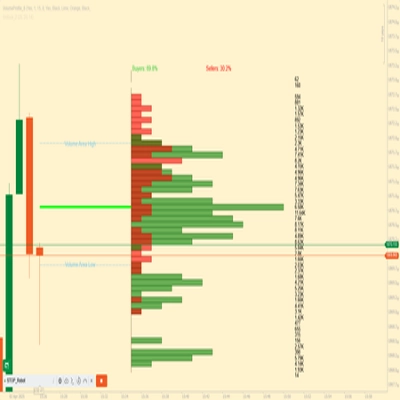
Advanced customizable volume-profile indicator with buy/sell levels, delta analysis, multi-TF support and vivid gradient
This Indicator will display either the speed or the acceleration of the current symbol.
Opening ranges, dynamic trend channels, and multi-scale breakout/retest analysis for clear intraday chart decisions.
Configure, simulate, and analyze trading strategies with custom filters, multi-target exits, and detailed performance me
Dynamically adjusts regression channels based on ZigZag extremes, resetting when price breaks bands to track real trends
Support and Resistance Line Indicator with Higher Timeframe Filter
Reversal Trap Probability Bands plots a dynamic volatility envelope around price & automatically detects "trap" reversal
RSI on the main chart with 45/55 momentum levels, overbought/oversold levels, averaged RSI, and multi-timeframe support.
A professional-grade cTrader indicator for traders following the Inner Circle Trader (ICT) methodology. It replaces 6–8
Multi VWAP. Three timeframes. One clean chart. Your Essential Trading Tool.
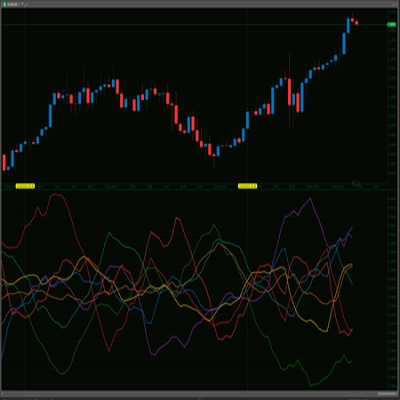
RCS: 8 majors! AUD,USD,EUR,JPY,GBP,CAD,CHF,NZD. Find how strong each currency is relatively and trade smarter!
This trading game allows you to explore and practice investment strategies in a real-time market data environment.
Scalpers Volume Profile
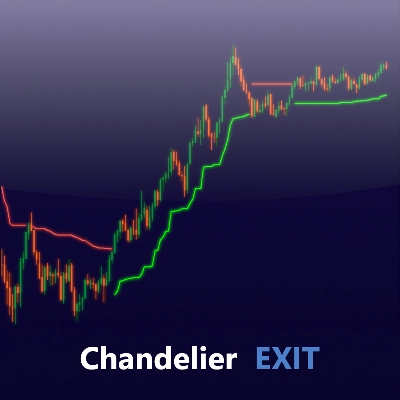
Optimize exits with Chandelier Exit! Visualize stop-loss points dynamically for improved trading precision and safety.
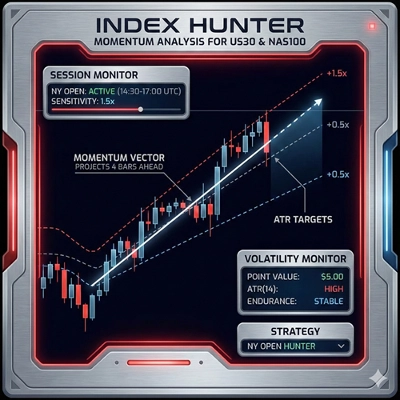
Index Hunter: Momentum analysis for US30 & NAS100. Designed to identify high-velocity moves and intraday trends.

Harga

Sejak 19/05/2025
82
Pemasangan percuma