Penerangan
MarketSessions – Kelebihan Dagangan Anda, Divisualisasikan
Ubah Masa Pasaran Menjadi Kuasa Dagangan
MarketSessions adalah penunjuk cTrader tahap profesional yang menghidupkan sesi pasaran global — supaya anda boleh berdagang di mana momentum adalah nyata dan masa menjadi kelebihan anda.
🚀 Kenapa Pedagang Mempercayai MarketSessions
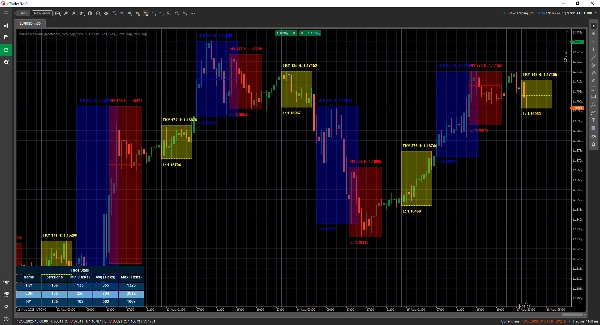
Lihat Irama Pasaran
Visualisasikan dengan segera London, New York, Tokyo, Sydney – dan sesi lain yang anda mahu – dengan lapisan yang bersih dan elegan yang menyesuaikan carta anda.
Berdagang Lebih Bijak, Bukan Kemudian
Dapatkan pemberitahuan masa nyata apabila sesi dibuka, ditutup atau mencapai tahap utama – dihantar melalui Telegram atau Discord (pilihan anda).
Serang Zon Kebarangkalian Tinggi
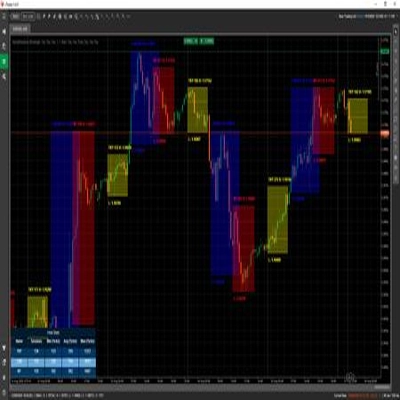
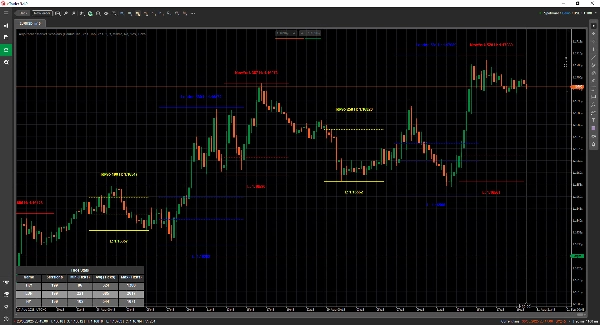
Manfaatkan alat terbina dalam seperti Pembukaan Julat Pecah, Titik Kawalan (POC) dan garis sesi tepat supaya anda tidak terlepas pecahan atau penolakan.
🎯 Ciri-ciri Utama
- Visualisasi & Pengurusan Sesi – masa, warna dan label yang boleh disesuaikan sepenuhnya, walaupun untuk pasaran yang bertindih
- Alat Lukisan Lanjutan – termasuk penggambaran Garis Berganda ❘❘ dan Garis Tengah, segi empat tepat pecahan, penanda teks dan Mod Garis Berganda untuk pedagang minimalis
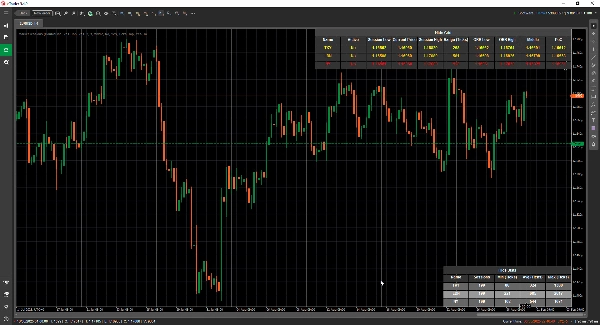
- Panel Statistik – lihat Jumlah Sesi, Julat Min, Purata dan Maksimum untuk setiap sesi (dalam Ticks, Pips atau %)
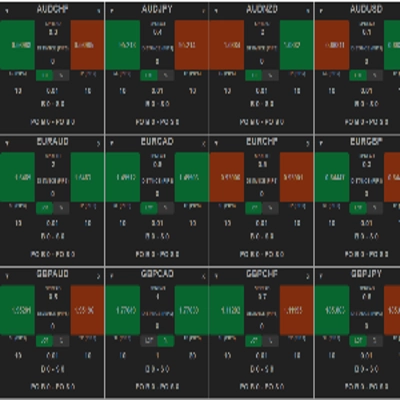
- Mod Grid - membolehkan anda melihat sesi aktif semasa dalam jadual, supaya anda boleh melihat sesi dalam jangka masa yang lebih tinggi.
- Konfigurasi Fleksibel – sesuaikan penempatan teks, mod julat, keutamaan lukisan dan tema
- Amaran & Integrasi – integrasi Telegram/Discord dengan amaran bunyi dan visual
📦 Apa Yang Anda Dapat
- MarketSessions.algo (sedia untuk digunakan)
- Kemas Kini Sepanjang Hayat (tiada yuran berulang)
- Sokongan Mesra (akses langsung jika anda memerlukan bantuan)
💻 Keperluan
- platform cTrader
- runtime .NET 6.0
✅ Pasang dalam beberapa minit
✅ Berdagang dengan keyakinan mutlak
📘 Rujukan Parameter (Versi Mesra)
Senarai Sesi Tersedia
- New York
- London
- Frankfurt
- Tokyo
- Hong Kong
- Shanghai
- Singapore
- Wellington
- Sydney
- Toronto
Tetapan Am
- Mod Lukisan – Pilih bagaimana garis sesi dilukis pada carta (Segi Empat / Garis Berganda / Garis Tengah)
- Tunjukkan Nama Sesi – Paparkan nama setiap sesi terus pada carta anda
- Lokasi Nama Sesi – Tentukan di mana teks nama sesi muncul (atas, tengah, bawah)
- Teks Tebal – Menjadikan nama sesi tebal supaya lebih mudah dibaca
- Jarak Teks Atas – Menambah jarak tambahan dari atas (supaya teks tidak bertindih lilin)
- Jarak Teks Bawah – Menambah jarak tambahan dari bahagian bawah kawasan sesi
- Lokasi Masa Teks – Paparkan masa sesi bersama nama sesi
- Gunakan Nama Sesi Pendek – Beralih kepada nama yang lebih pendek (contoh NY menggantikan New York)
- Tunjukkan Julat Sesi – Sorot julat harga penuh yang diliputi oleh sesi
- Mod Julat Sesi – Pilih bagaimana julat harga dikira (tinggi/rendah atau buka/tutup)
- Lokasi Julat Sesi – Letakkan penanda julat sama ada di atas atau bawah julat
- Tunjukkan Tinggi – Paparkan harga tertinggi sesi
- Lokasi Tunjukkan Tinggi – Pilih di mana label Tinggi muncul
- Tunjukkan Rendah – Paparkan harga terendah sesi
- Lokasi Tunjukkan Rendah – Pilih di mana label Rendah muncul
- Lanjutkan Garis Tinggi/Rendah (Minit) - Membenarkan lanjutan garis ini untuk x minit ke hadapan
- Tunjukkan Pecahan Julat Pembukaan – Lukis kotak pecahan pada pembukaan sesi
- Lanjutkan Garis ORB (Minit) - Membenarkan lanjutan garis ini untuk x minit ke hadapan
- Tunjukkan Garis Tengah – Tambah garis tengah untuk membantu mengenal pasti nilai adil
- Lanjutkan Garis Tengah (Minit) - Membenarkan lanjutan garis ini untuk x minit ke hadapan
- Tunjukkan PoC – Paparkan Titik Kawalan (harga paling banyak didagangkan dalam sesi)
- Lanjutkan Garis Tengah (Minit) - Membenarkan lanjutan garis ini untuk x minit ke hadapan
- Ketelusan Terisi – Kawal sejauh mana latar belakang sesi telus
Statistik
- Lukis Statistik – Tunjuk/sembunyi panel statistik pada carta anda
- Penjajaran Mendatar Statistik – Selaraskan panel (Kiri / Tengah / Kanan)
- Penjajaran Menegak Statistik – Pilih sama ada panel muncul di atas atau bawah
- Warna Tajuk – Warna teks untuk tajuk “Statistik”
- Warna Baris Genap – Warna latar belakang untuk baris bernombor genap dalam panel
- Warna Baris Ganjil – Warna latar belakang untuk baris bernombor ganjil dalam panel
- Warna Hadapan – Warna teks yang digunakan di dalam panel
Telegram
- Gunakan – Aktifkan atau nyahaktifkan amaran Telegram
- Token – Token Bot Telegram anda
- ChatId – ID sembang di mana amaran akan dihantar
Discord
- Gunakan – Aktifkan atau nyahaktifkan amaran Discord
- WebhookUrl – URL webhook Discord untuk menghantar amaran sesi
Amaran Bunyi
- Amaran Bunyi Sesi Baru – Mainkan bunyi apabila sesi baru bermula
- Amaran Bunyi Sesi Selesai – Mainkan bunyi apabila sesi berakhir
Grid
- Paksa Grid - Memaksa grid dipaparkan tanpa mengira TimeFrame yang digunakan
- Grid Boleh Dilihat untuk TimeFrame Di Atas - Membolehkan anda memilih pada TimeFrame mana dan ke atas Grid ini boleh dilihat
- Pemberitahuan Kotak Mesej - Memaklumkan mengapa mod paparan biasa tidak boleh digunakan dan beralih ke Mod Grid
- Penjajaran Mendatar Grid
- Penjajaran Menegak Grid
Contoh Sesi (New York)
⚠️ Parameter yang sama digunakan untuk setiap sesi (London, Tokyo, Sydney, dll.)
- Aktif – Aktifkan atau nyahaktifkan sesi tertentu ini
- Warna – Warna sesi yang digunakan pada carta
- Isi Kawasan – Isi latar belakang kawasan sesi
- Gaya Garis – Pilih gaya garis (pejal, putus-putus, dll.)
- Ketebalan Garis – Kawal ketebalan sempadan sesi
Jadikan jam pasaran sebagai sekutu anda
Dapatkan MarketSessions hari ini dan jangan pernah terlepas sesi yang menguntungkan lagi.
Ringkasan
Key features include a statistics panel displaying session ranges in ticks, pips, or percentages; advanced drawing tools like breakout rectangles and text markers; and real-time alerts for session openings, closings, and key levels via Telegram or Discord integrations. It highlights important trading zones such as Opening Range Breakouts and Points of Control (POC) to assist in identifying breakout or rejection points.
Users can configure text placement, range calculation methods, transparency, and alert sounds. The indicator supports multiple sessions with individual settings for activation, color, fill, line style, and thickness. It requires the cTrader platform and .NET 6.0 runtime to operate. This tool aims to help traders align their strategies with market momentum by clearly displaying session rhythms and statistics.