الوصف
مذبذب تدفق سعر PFO هو أداة تحليل فني مصممة لتزويد المتداولين برؤية منظمة لزخم السوق وتقلباته. يجمع بين عدة عوامل سوقية في مذبذب موحد واحد، مما يسمح للمستخدمين بتفسير حركة السعر بشكل أوضح في ظروف مختلفة. المؤشر مجاني للاستخدام ويمكن تطبيقه على الفوركس والسلع والمؤشرات والأصول الأخرى.
كيف يعمل
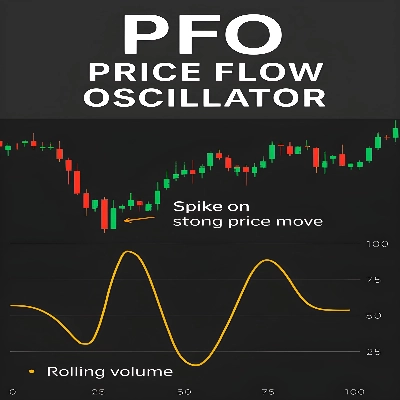
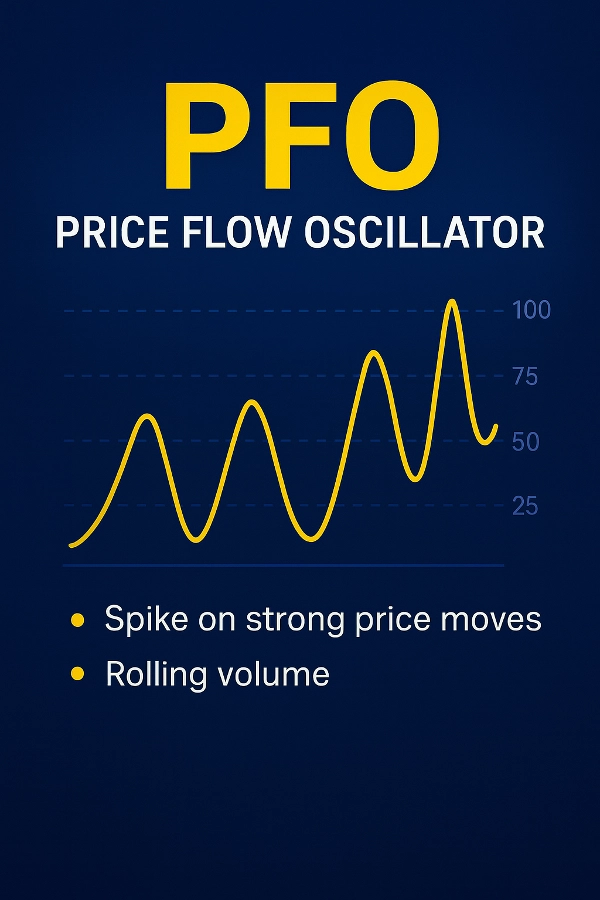
يقوم مذبذب PFO بحساب قيمة موحدة (0–100) بناءً على:
ATR (المتوسط الحقيقي للنطاق): يضبط القراءات بما يتماشى مع تقلبات السوق.
المتوسطات المتحركة (EMA/SMA): توفر خط أساس للاتجاه لمقارنة الزخم.
تحليل الحجم: يقارن النشاط الحالي بالمتوسطات المتحركة لتسليط الضوء على التحركات الأقوى.
عوامل حركة السعر:
حجم الجسم مقابل النطاق (قوة الشمعة).
تحليل الفتيل (ضغط الشراء/البيع).
الانحياز الاتجاهي (حركة صاعدة مقابل هابطة).
الزخم مقابل ATR: يقيس الانحراف عن الاتجاه نسبةً إلى التقلب.
توزين حركة السعر: يبرز التغيرات الكبيرة من شريط إلى آخر.
التنعيم والتوحيد: يفلتر الضوضاء ويقنن النتائج على مقياس من 0 إلى 100.
قراءة المذبذب
أعلى من 75: يشير إلى ظروف صعودية أقوى.
أدنى من 25: يشير إلى ظروف هبوطية أقوى.
حول 50: يشير إلى سلوك سوق محايد أو متماسك.
الميزات الرئيسية
نهج متعدد العوامل: يدمج التقلب، الاتجاه، الحجم، وحركة السعر.
قيم ملساء للوضوح وتقليل الضوضاء.
تدرج تكيفي يتكيف مع ظروف السوق المختلفة.
يعمل عبر فئات أصول وأطر زمنية متعددة.
إخلاء المسؤولية: هذا المؤشر مخصص لأغراض التحليل الفني فقط. لا يتنبأ بالأداء المستقبلي أو يضمن نتائج التداول. يجب على المستخدمين دمجه مع تحليلاتهم الخاصة وممارسات إدارة المخاطر.
الملخص
تقييمات العملاء
5 | 0 % | |
4 | 100 % | |
3 | 0 % | |
2 | 0 % | |
1 | 0 % |


