Descrizione
BullBear Dynamics — Indicatore di Trend e Momentum per cTrader
BullBear Dynamics è un indicatore robusto e consapevole della volatilità per la piattaforma cTrader, progettato per aiutare i trader a rilevare e interpretare l'equilibrio tra momentum rialzista e ribassista nel mercato. Combina medie mobili, normalizzazione ATR e soglie dinamiche per fornire uno strumento preciso e visivamente intuitivo per la valutazione del trend.
Metodologia e Logica Interna
L'indicatore calcola due Medie Mobili Esponenziali (EMA): una EMA a breve termine e una EMA a lungo termine.
Successivamente prende la differenza tra queste EMA e la divide per l'Average True Range (ATR). Questa normalizzazione aiuta ad adattare i segnali di momentum in relazione alla volatilità di mercato attuale.
Una linea di segnale — un'EMA applicata ai valori normalizzati — filtra il rumore e smussa le fluttuazioni minori.
Per distinguere movimenti deboli da quelli forti, lo strumento calcola la deviazione standard mobile (StdDev) su una finestra di lookback e la moltiplica per un fattore per definire soglie superiori e inferiori.
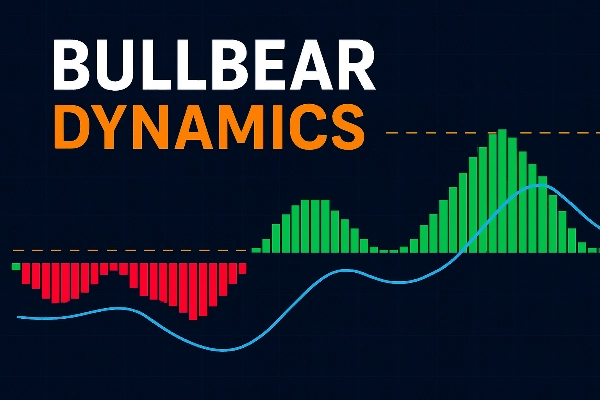
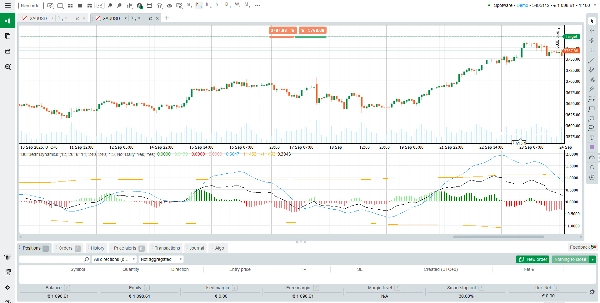
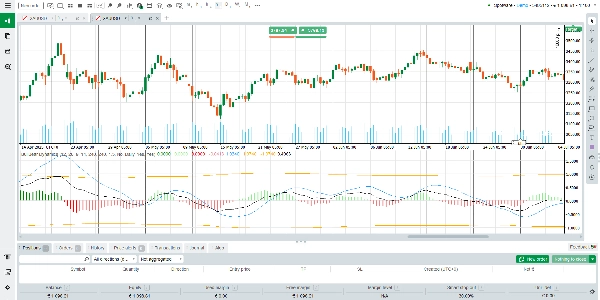
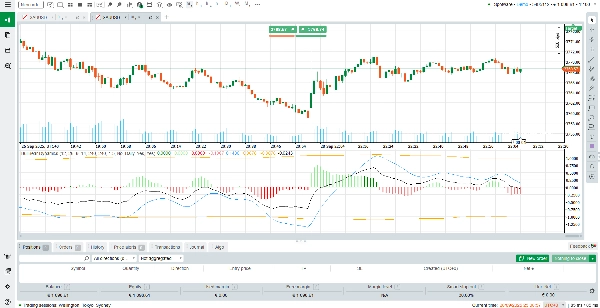
L'output finale è visualizzato come un istogramma (con più stati di colore) più la linea di segnale e i confini delle soglie.
Come Leggere e Interpretare l'Output
Barre dell'Istogramma (Verde / Rosso):
• Il verde indica momentum rialzista; il rosso indica momentum ribassista.
• Colore intenso (più brillante o pieno) significa che l'istogramma supera la soglia — implicando un movimento forte.
• Colore più debole significa che l'istogramma rimane entro i limiti della soglia — implicando un momentum lieve o rumore.
Linea di Segnale:
• Funziona come linea di riferimento.
• Quando l'istogramma attraversa la linea di segnale verso l'alto, segnala un potenziale rafforzamento del momentum rialzista.
• Quando attraversa verso il basso, segnala un potenziale rafforzamento del momentum ribassista.
Linee di Soglia (Superiore e Inferiore):
• Queste linee tratteggiate definiscono zone di significato.
• Una barra dell'istogramma che supera una soglia indica un movimento di momentum forte e ad alta affidabilità.
• Barre che rimangono entro le soglie suggeriscono un range o indecisione — i segnali sono meno affidabili.
Scenari e Letture:
Momentum rialzista — barre verdi sopra la linea di segnale, preferibilmente anche oltre la soglia superiore.
Momentum ribassista — barre rosse sotto la linea di segnale, preferibilmente anche oltre la soglia inferiore.
Neutro / in range — barre oscillano entro le soglie, i colori possono alternarsi, ampiezza ridotta.
Cambio o inversione di momentum — l'istogramma attraversa la linea di segnale, accompagnato da cambio di colore; se supera anche la soglia, maggiore affidabilità.
Suggerimenti d'Uso e Best Practice
Usa BullBear Dynamics in combinazione con altri strumenti (filtri di trend, supporto/resistenza, analisi di pattern) per conferma.
Sii cauto nell'interpretare segnali durante periodi di bassa volatilità quando le barre dell'istogramma rimangono entro le soglie.
Dai priorità ai segnali in cui l'istogramma attraversa la linea di segnale e rompe le soglie.
Conferma l'allineamento direzionale su timeframe superiori prima di agire sui segnali di timeframe inferiori.
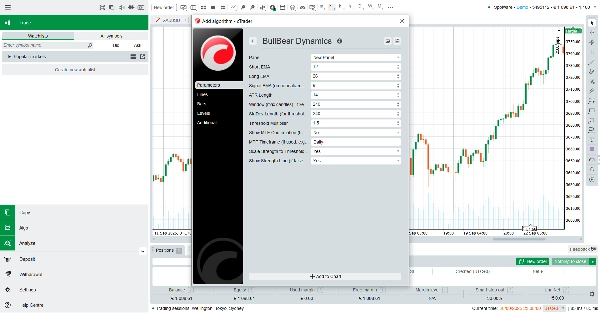
Regola i parametri (lunghezze EMA, moltiplicatore soglia, finestra StdDev) secondo necessità per adattarsi a diversi mercati (Forex, indici, materie prime, crypto).
Caratteristiche Chiave e Punti Salienti
Normalizzazione Adattativa alla Volatilità — il momentum è scalato dall'ATR, quindi i segnali sono più affidabili in ambienti di mercato variabili.
Soglie Dinamiche — costruite dalla deviazione standard mobile, si adattano alle condizioni di mercato prevalenti, aiutando a ridurre falsi breakout.
Chiaro Istogramma Multicolore — distinzione visiva tra momentum forte e debole, e tra rialzista e ribassista.
Ampia Compatibilità — funziona su tutti gli strumenti e timeframe supportati da cTrader.
Gratuito — disponibile senza costi; ideale per trader che vogliono capacità avanzate di indicatori senza abbonamento.
Riepilogo
The output is displayed as a multi-color histogram with green bars indicating bullish momentum and red bars indicating bearish momentum. The intensity of the colors reflects the strength of the momentum relative to dynamically calculated upper and lower thresholds. The signal line serves as a baseline to identify potential momentum shifts when the histogram crosses it. Threshold lines mark zones of significant momentum moves, with bars crossing these lines signaling stronger trends.
BullBear Dynamics supports all instruments and timeframes available on cTrader, including Forex, commodities, indices, and cryptocurrencies. It is recommended to use this indicator alongside other analysis tools for confirmation and to adjust its parameters to fit different market conditions and trading styles such as scalping.
Recensioni dei clienti
5 | 100 % | |
4 | 0 % | |
3 | 0 % | |
2 | 0 % | |
1 | 0 % |