
ADX and ADI
Indicatore
258 download
Versione 1.0, Aug 2025
Windows, Mac
5.0
Recensioni: 2
Da 21/02/2025
466.3M
Volume negoziato
180.83K
Profitto in pip
22
Vendite
6.79K
Installazioni gratuite
Descrizione
Caratteristiche principali:
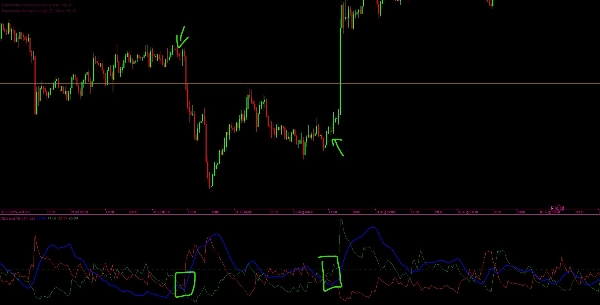
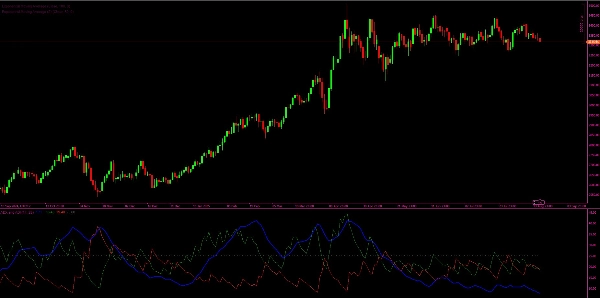
- Linea ADX e ADI (Blu): Mostra la forza smussata della tendenza attuale, indipendentemente dalla direzione.
- Linea +DI (Verde): Indica la forza dei movimenti al rialzo.
- Linea -DI (Rossa): Indica la forza dei movimenti al ribasso.
- Linea di soglia (Grigia): Un livello di riferimento orizzontale (predefinito 25) per aiutare a identificare se la forza della tendenza è significativa.
Come funziona:
- L'indicatore calcola True Range (TR), Movimento Direzionale Positivo (+DM), e Movimento Direzionale Negativo (-DM).
- Applica la tecnica di smussamento di Wilder per calcolare i valori smussati di TR, +DM e -DM.
- Da questi, vengono derivati i Indicatori Direzionali (+DI e -DI), che mostrano quale lato (rialzista o ribassista) ha un momentum più forte.
- Il DX (Indice Direzionale) viene calcolato dalla differenza relativa tra +DI e -DI.
- Infine, l'ADX (Indice Direzionale Medio) viene calcolato come una versione smussata del DX, fornendo una misura della forza complessiva della tendenza.
Interpretazione:
- Quando l'ADX è sopra la soglia (es. 25), il mercato è considerato in forte tendenza.
- Quando +DI > -DI, i rialzisti sono al controllo (tendenza al rialzo).
- Quando -DI > +DI, i ribassisti sono al controllo (tendenza al ribasso).
- Quando l'ADX è sotto la soglia, il mercato è considerato laterale (debole o senza tendenza).
Riepilogo
Profilo indicatore
Recensioni dei clienti
5.0
Recensioni: 2
5 | 100 % | |
4 | 0 % | |
3 | 0 % | |
2 | 0 % | |
1 | 0 % |
Recensioni dei clienti
December 1, 2025
ADX and ADI delivers clean trend strength and direction signals. ADX shows when the market is actually trending, while +DI and -DI reveal who’s in control. Stable, lightweight and reliable across all timeframes. Best on H1+ for smoother signals. Alerts and zone-highlighting would be great additions.
September 12, 2025
Discussioni
Domande frequenti
I prodotti disponibili tramite cTrader Store, inclusi bot di trading, indicatori e plugin, sono forniti da sviluppatori terzi e resi disponibili esclusivamente a scopo informativo e di accesso tecnico. cTrader Store non è un broker e non fornisce consulenze in materia di investimento, raccomandazioni individualizzate o garanzie di risultati futuri.


Prezzo
Da 21/02/2025
466.3M
Volume negoziato
180.83K
Profitto in pip
22
Vendite
6.79K
Installazioni gratuite