
설명
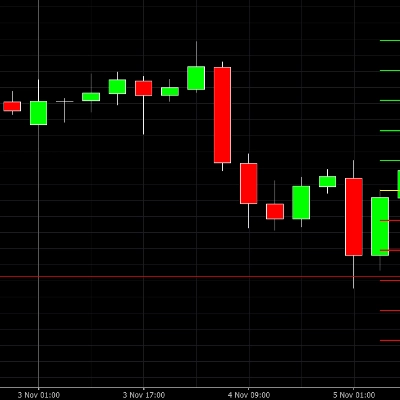
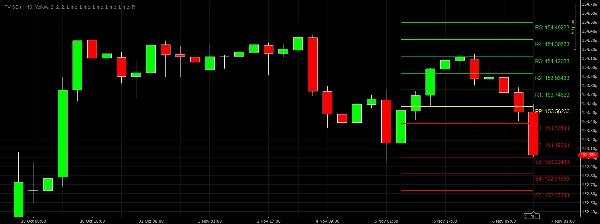
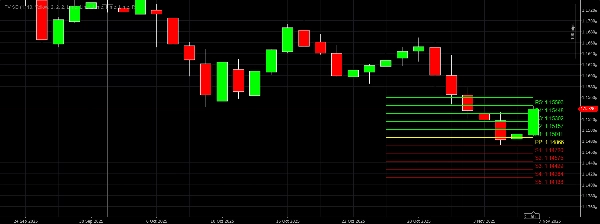
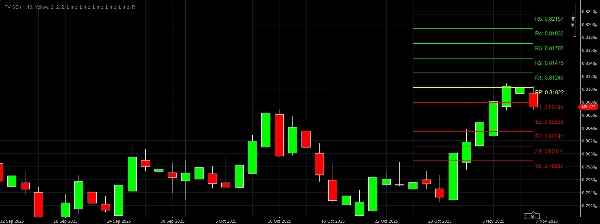
표준 편차를 사용한 전문 피벗 포인트 지표로, 5개의 지지선(S1–S5)과 5개의 저항선(R1–R5)을 완전히 사용자 정의할 수 있습니다. 모든 타임프레임에서 작동하며 캔들 마감 후에만 업데이트됩니다.
전체 설명:
이 강력한 지표는 표준 편차를 사용하여 피벗 포인트를 계산하여 모든 차트에 대해 정확한 지지 및 저항 수준을 제공합니다. 완전히 사용자 정의 가능하며 명확성과 사용 편의성을 위해 설계되었습니다.
특징:
- 모든 타임프레임 지원: 5분, 15분, 30분, 1시간, 2시간, 4시간, 6시간, 8시간, 12시간, 일간, 연간.
- 5개의 저항선(R1–R5) 및 5개의 지지선(S1–S5), 그리고 피벗 포인트(PP)를 포함합니다.
- 각 레벨별 사용자 정의 가능한 색상을 드롭다운 메뉴를 통해 설정할 수 있습니다.
- 캔들 수에 따른 조절 가능한 선 길이 (
LineLength). - 피벗, 지지선, 저항선의 조절 가능한 선 두께.
- 캔들 마감 후에만 레벨 업데이트로 형성 중 움직임을 방지합니다.
- 각 선에 이름과 가격을 표시하는 라벨.
- 외환, 주식, 암호화폐, CFD 등 모든 거래 유형에 적합한 깔끔하고 전문적인 디자인.
사용 방법:
- 지표를 차트에 적용합니다.
- 표준 편차 계산을 제어하기 위해 배수(Multiplier)를 설정합니다.
- 드롭다운을 사용하여 각 레벨의 색상을 선택합니다.
- 필요에 따라 선 두께를 조절합니다.
- 각 캔들이 마감될 때마다 지표가 자동으로 업데이트됩니다.
적합한 용도:
- 주요 지지 및 저항 수준 식별.
- 모든 타임프레임에서 거래.
- 더 정확한 진입 및 청산을 위해 피벗 포인트와 표준 편차 결합.
요약
AI summary
PV SD is a professional pivot points indicator that calculates support and resistance levels using standard deviation. It provides 5 support levels (S1–S5), 5 resistance levels (R1–R5), and a central pivot point (PP) for any chart. The indicator supports all timeframes, from 5 minutes up to yearly, and updates levels only after each candle closes to avoid intra-candle fluctuations.
Key features include customizable colors for each level, adjustable line length based on the number of candles, and configurable line thickness for pivot, support, and resistance lines. Each level is clearly labeled with its name and price for easy reference. The design is clean and professional, suitable for various trading markets such as Forex, stocks, cryptocurrencies, and CFDs.
To use, apply the indicator to a chart, set the multiplier to control the standard deviation calculation, choose colors, and adjust line thickness as needed. The indicator automatically updates after candle close, helping traders identify precise support and resistance levels for any timeframe.
지표 프로필
고객 리뷰
0.0
리뷰: 0
고객 리뷰
이 상품에 대한 리뷰가 아직 없습니다. 이미 사용해 보셨나요? 다른 사람들에게 가장 먼저 소개해 주세요!
상담
자주 묻는 질문(FAQ)
Forex
Scalping
XAUUSD
USDJPY
트레이딩 봇, 지표, 플러그인 등 cTrader Store에서 제공되는 상품은 제3자 개발자에 의해 제공되며, 이는 단순히 정보 및 기술적 접근을 목적으로 제공된 것입니다. cTrader Store는 중개인이 아니며, 투자 조언, 개인별 추천 또는 향후 성과에 대한 어떠한 보장도 제공하지 않습니다.











가격

가입일 15/10/2025