
Penerangan
APA YANG DILAKUKANNYA
Melukis automatik empat alat Fibonacci dari pengesanan ayunan bersatu—menghapuskan subjektiviti dan mengekalkan konsistensi dalaman merentasi zon retracement, pengembangan, kipas, dan masa.
Lukisan Fibonacci manual adalah kuat tetapi subjektif. Pedagang yang berbeza melukis tahap yang berbeza pada carta yang sama. Alat Fibonacci automatik biasanya menawarkan satu jenis analisis — retracement ATAU pengembangan ATAU kipas — memaksa anda menambah pelbagai penunjuk atau melukis selebihnya secara manual.
Penunjuk ini menggabungkan empat alat Fibonacci ke dalam satu sistem.
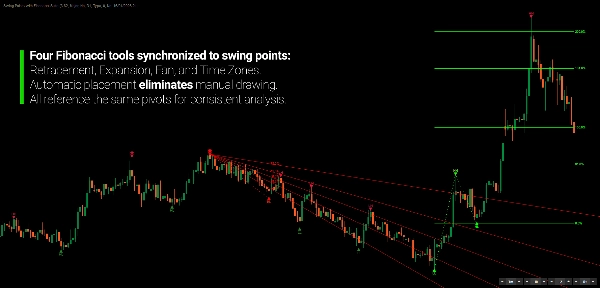
Retracement, Pengembangan, Kipas, dan Zon Masa dikira secara automatik dari logik pengesanan ayunan yang sama. Apabila pivot struktur baru terbentuk, keempat-empat alat dikemas kini secara masa nyata, berlabuh pada titik ayunan yang sama. Tiada lukisan manual. Tiada variasi tafsiran. Tiada pertukaran antara alat.
Hasilnya adalah analisis Fibonacci yang komprehensif yang mengekalkan konsistensi dalaman.
MENGAPA FIBONACCI AUTOMATIK PENTING
Analisis Fibonacci digunakan secara meluas kerana ia mencerminkan bagaimana pasaran secara semula jadi retrace dan meluaskan. Nisbah emas muncul secara konsisten dalam struktur harga, menjadikan tahap Fibonacci sebagai titik rujukan yang berharga untuk sokongan, rintangan, dan sasaran unjuran.
Masalahnya
Analisis Fibonacci manual memperkenalkan tiga cabaran praktikal:
- Subjektiviti — Pedagang yang berbeza memilih titik ayunan yang berbeza
- Penggunaan masa — Melukis empat alat merentasi pelbagai jangka masa memerlukan kerja carta yang ketara
- Ketidakkonsistenan — Retracement dari ayunan A-B, pengembangan dari B-C, kipas dari C-D mencipta analisis yang terputus
Dalam praktiknya, alat Fibonacci automatik sering menyelesaikan isu masa, tetapi masih bergantung pada logik ayunan yang terputus. Mereka akan melukis retracement secara automatik, tetapi anda masih meletakkan alat pengembangan dan kipas secara manual dari ayunan yang berbeza.
Penyelesaiannya
Penunjuk ini menggunakan keempat-empat alat Fibonacci pada satu model ayunan yang dikongsi. Apabila algoritma mengenal pasti titik ayunan A, B, dan C:
- Retracement melukis dari pasangan ayunan terkini
- Pengembangan meramalkan berdasarkan struktur tiga ayunan
- Kipas memancar dari ayunan sauh
- Zon Masa menandakan selang masa ke hadapan dari ayunan asas
Setiap alat merujuk kepada pivot struktur yang sama, memastikan keseluruhan analisis koheren secara dalaman merentasi semua pandangan Fibonacci.
KONSEP TERAS
Pengesanan Ayunan
Penunjuk menggunakan kaedah regresi untuk melicinkan tindakan harga dan mengenal pasti titik pivot struktur. Berbeza dengan ekstrem harga mudah atau persilangan penunjuk, regresi menghasilkan pivot yang mencerminkan perubahan trend sebenar dan bukannya volatiliti sementara.
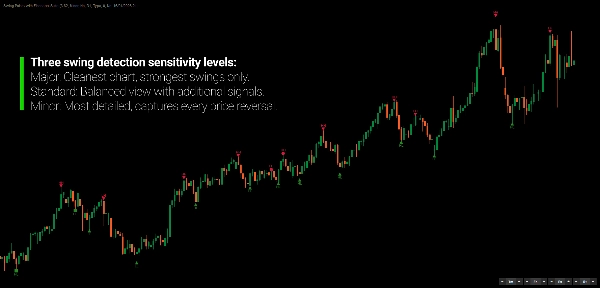
Tiga mod pengesanan mengawal kepekaan:
- Utama — Penapis paling ketat, mengenal pasti hanya pivot struktur pasaran utama
- Standard — Pendekatan seimbang untuk jangka masa dagangan ayunan
- Minor — Termasuk ayunan lawan trend dalam trend yang lebih besar untuk analisis terperinci
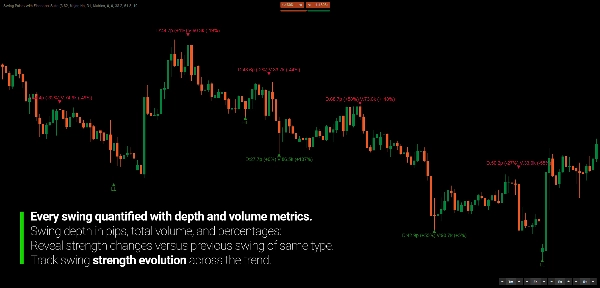
Setiap ayunan diklasifikasikan (HH, HL, LH, LL) dan secara pilihan dilabel dengan metrik: kedalaman, volum, tempoh, kecekapan, penyerapan, dan keyakinan. Peratusan perbandingan menunjukkan bagaimana kekuatan ayunan semasa berkaitan dengan ayunan sebelumnya dari jenis yang sama.
Integrasi Fibonacci
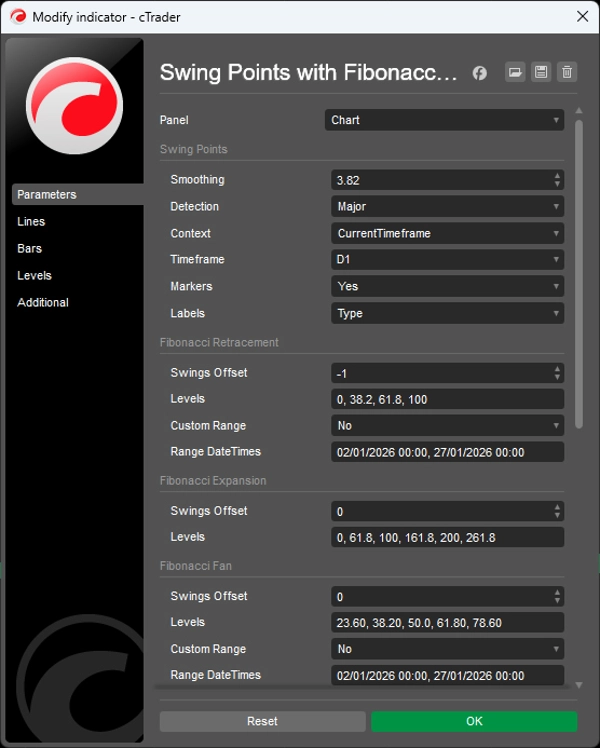
Setelah ayunan dikesan, empat alat Fibonacci melukis secara automatik:
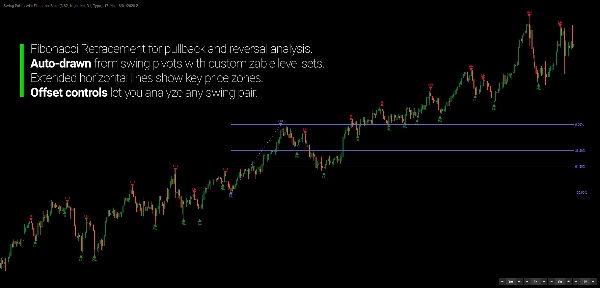
- Retracement — Tahap mendatar dari pasangan ayunan terkini
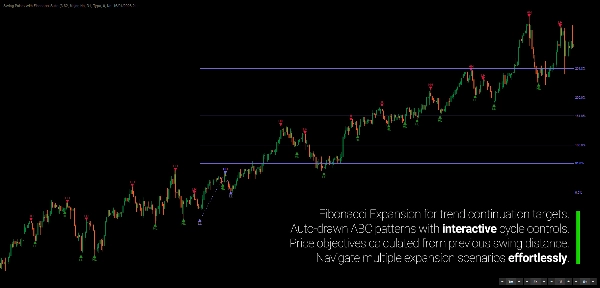
- Pengembangan — Unjuran harga berdasarkan struktur ABC
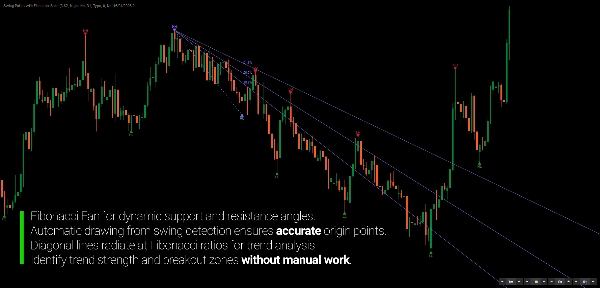
- Kipas — Saluran trend serong dari titik sauh
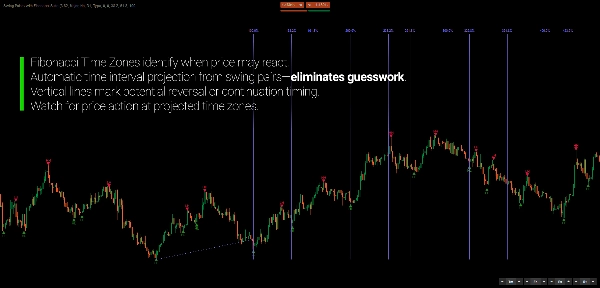
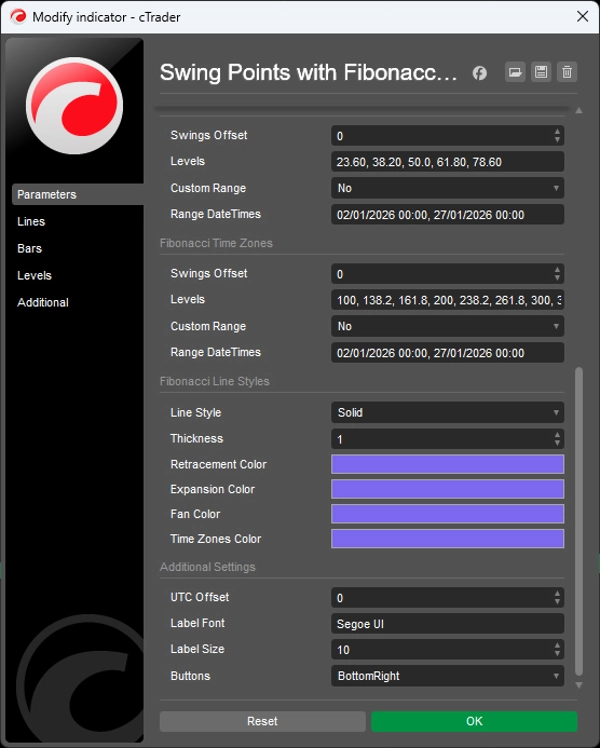
- Zon Masa — Unjuran masa menegak menggunakan selang Fibonacci
Setiap alat mempunyai kawalan offset bebas melalui butang pada carta. Laraskan pasangan ayunan yang menggerakkan setiap jenis analisis tanpa mengira semula atau melukis semula secara manual.
Keempat-empat alat juga boleh beroperasi dalam mod julat tersuai, di mana anda menentukan masa mula/akhir yang tepat dan bukannya menggunakan ayunan yang dikesan — berguna untuk menganalisis acara atau sesi pasaran tertentu.
Konteks Pelbagai Jangka Masa
Penunjuk boleh mengesan ayunan pada jangka masa lebih tinggi sambil memaparkan pada carta semasa anda. Lihat ayunan Harian dan tahap Fibonacci mereka pada carta H1 tanpa menukar jangka masa.
Ini menyediakan konteks struktur dari jangka masa lebih tinggi terus pada carta pelaksanaan, membantu menyelaraskan kemasukan dengan arah pasaran yang lebih luas.
CIRI UTAMA
Pengesanan Ayunan
- Penapisan regresi untuk pengenalpastian pivot struktur
- Tiga mod pengesanan: Utama (struktur utama), Standard (dagangan ayunan), Minor (ayunan dalaman terperinci)
- Keupayaan pelbagai jangka masa — mengesan ayunan pada TF lebih tinggi, memaparkan pada carta TF lebih rendah
- Klasifikasi ayunan — label HH/HL/LH/LL mengesahkan struktur trend
- Tiga jenis penanda — Segitiga (disahkan), Bulatan (hanya keadaan), Petak (ayunan dalaman)
Alat Fibonacci
- Retracement — sembilan tahap boleh laras (0% hingga 100%)
- Pengembangan — lapan tahap unjuran (0% hingga 261.8%)
- Kipas — lima saluran serong (23.6% hingga 78.6%)
- Zon Masa — sembilan selang masa (100% hingga 322.8%)
- Kawalan offset bebas untuk setiap alat melalui butang UI pada carta
- Mod julat tersuai — menggantikan pengesanan ayunan dengan julat tarikh dan masa manual
Metrik Ayunan
- Metrik asas — Kedalaman (pips), Volum (volum tick), Tempoh (bar)
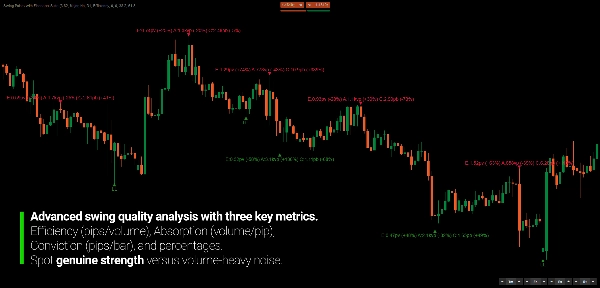
- Nisbah kecekapan — Kecekapan (pips per volum), Penyerapan (volum per pip), Keyakinan (pips per bar)
- Analisis perbandingan — perubahan peratusan berbanding ayunan sebelumnya dari jenis yang sama
SIAPA YANG SESUAI
Penunjuk ini direka untuk pedagang yang menggunakan Fibonacci sebagai rujukan struktur dan bukan isyarat berdiri sendiri.
Jika anda kerap melukis retracement, lanjutan, atau zon masa Fibonacci, alat ini mensistematikkan proses itu. Daripada meletakkan pelbagai alat secara manual merentasi ayunan yang berbeza, penunjuk mengekalkan keempat-empat secara serentak dari titik rujukan struktur yang sama.
Ia sesuai untuk pedagang ayunan dan posisi yang menganalisis pelbagai jangka masa dan mahu struktur jangka masa lebih tinggi kelihatan pada carta pelaksanaan. Pedagang yang fokus pada Fibonacci akan mendapat manfaat daripada mempunyai analisis retracement, pengembangan, kipas, dan masa disatukan dalam satu rangka kerja.
Penganalisis pelbagai jangka masa boleh memaparkan ayunan Harian atau Mingguan pada carta intrahari tanpa menukar tetingkap, sementara penganalisis teknikal mendapat akses kepada metrik ayunan (kecekapan, penyerapan, keyakinan) yang biasanya memerlukan pengiraan manual.
Ini bukan sistem isyarat kemasukan. Ia adalah rangka kerja struktur untuk mentafsir Fibonacci dalam konteks pasaran — mengurangkan beban lukisan manual sambil mengekalkan kedalaman analisis yang menjadikan alat Fibonacci berharga.
APA YANG MEMBEZAKANNYA
Menggunakan pelbagai alat Fibonacci biasanya bermakna bekerja dengan pelbagai tafsiran ayunan. Tanpa rujukan struktur yang bersatu, menggabungkan retracement, pengembangan, kipas, dan unjuran masa boleh menghasilkan perspektif yang terputus dan bukannya rangka kerja yang koheren.
Penunjuk ini menyatukan keempat-empat alat di bawah satu algoritma pengesanan ayunan. Setiap pandangan Fibonacci dibina pada pivot struktur yang sama, memastikan unjuran yang berbeza mencerminkan konteks pasaran asas yang sama.
Pendekatan regresi menapis volatiliti jangka pendek sambil mengekalkan relevansi struktur. Mod utama mengenal pasti hanya pivot pasaran utama. Mod minor mendedahkan struktur lawan trend terperinci dalam ayunan yang lebih besar. Algoritma yang sama, kepekaan berbeza.
Keupayaan pelbagai jangka masa membawa konteks jangka masa lebih tinggi ke carta pelaksanaan tanpa pertukaran carta. Lihat ayunan Harian dan analisis Fibonacci lengkap mereka pada carta H1 — konteks struktur pada jangka masa dagangan anda.
Kawalan offset bebas membolehkan analisis serentak pelbagai struktur ayunan. Retracement dari ayunan terkini sementara pengembangan meramalkan dari susunan sebelumnya. Semua dikawal melalui butang pada carta tanpa pelarasan panel parameter.
---
MEMAHAMI FIBONACCI DALAM STRUKTUR PASARAN
Nisbah Fibonacci muncul dalam sistem semula jadi, termasuk pasaran kewangan. Kecenderungan retracement berhenti dekat tahap 38.2%, 50%, atau 61.8%, dan lanjutan mencapai unjuran 127.2% atau 161.8%, mencerminkan geometri pasaran asas dan bukannya sifat mistik.
Tahap ini menjadi pemenuh sendiri hingga tahap tertentu — cukup ramai pedagang memerhatikannya sehingga mempengaruhi aliran pesanan — tetapi ketahanan mereka merentasi jangka masa dan instrumen menunjukkan sesuatu yang lebih struktur.
Dari sudut praktikal, tahap Fibonacci menyediakan titik rujukan objektif dalam analisis carta yang subjektif. Daripada meneka di mana sokongan mungkin terbentuk dalam pullback, retracement Fibonacci memberi anda zon harga tertentu untuk dipantau.
Cabarannya bukan sama ada Fibonacci berfungsi — tetapi mengekalkan konsistensi dalam cara anda menggunakannya. Analisis manual memperkenalkan variasi: ayunan mana yang anda ukur? Adakah anda menggunakan wick atau penutupan? Bagaimana anda mengendalikan retracement bertindih dari pelbagai pasangan ayunan?
Penggunaan sistematik menghapuskan soalan-soalan ini. Algoritma memilih ayunan dengan kriteria yang sama setiap kali. Keempat-empat alat merujuk pivot yang sama. Analisis menjadi boleh diulang dan boleh dibandingkan merentasi keadaan pasaran yang berbeza.
Ini tidak menghapuskan budi bicara — anda masih memutuskan offset ayunan mana untuk dianalisis, tahap mana yang penting untuk susunan anda, dan bagaimana mentafsir konfluens antara alat. Tetapi ia mewujudkan asas yang konsisten untuk budi bicara itu.
---
Perdagangan melibatkan risiko. Penunjuk ini adalah alat analisis teknikal — sentiasa gunakan pengurusan risiko yang betul.


