Penerangan
APA YANG DILAKUKANNYA
Sokongan & Rintangan Berdasarkan Kecairan mengenal pasti di mana harga sebenarnya berbalik — bukan hanya di mana garis boleh dilukis.
Ia mengesan titik ayunan di seluruh carta anda, memetakannya ke tahap nombor bulat psikologi, dan mengkuantifikasi aktiviti pembelian/penjualan di setiap zon. Anda dapat melihat tahap mana yang menunjukkan aktiviti kecairan yang bermakna, dan yang mana hanya garis kosong.
Hasilnya adalah sokongan dan rintangan dengan konteks — bias, penyerapan volum, kecekapan, dan tafsiran yang boleh diambil tindakan terbina di dalamnya.
KENAPA IA PENTING
Kaedah sokongan dan rintangan tradisional berkongsi kelemahan yang sama: mereka menunjukkan kepada anda di mana harga berada, tetapi tidak memberitahu apa-apa tentang apa yang berlaku di sana.
Tahap harga yang disentuh dua kali dan tahap yang diuji lima belas kali dengan volum berat kelihatan sama pada penunjuk SR standard. Tetapi mereka berkelakuan sangat berbeza apabila harga kembali.
Masalahnya
Melukis garis pada titik ayunan adalah mudah. Memahami sama ada tahap itu akan bertahan, pecah, atau memerangkap pedagang memerlukan analisis yang lebih mendalam yang kebanyakan alat SR tidak sediakan:
- Berapa banyak pembalikan sebenarnya berlaku pada tahap itu?
- Adakah pembeli atau penjual yang menguasai?
- Adakah penolakan itu cekap atau adakah ia memerlukan penyerapan volum yang besar?
- Adakah tahap itu mengumpul tenaga untuk pecahan, atau mengagihkan sebelum kegagalan?
Penyelesaiannya
Penunjuk ini mengukur tandatangan kecairan di setiap tahap — berapa banyak pembalikan berlaku, sejauh mana ia berjalan, berapa banyak volum yang terlibat, dan sama ada pembeli atau penjual beroperasi dengan lebih cekap.
Daripada meneka tahap mana yang penting, anda dapat melihat dengan tepat apa yang telah dilakukan pasaran di setiap zon.
BAGAIMANA IA BERFUNGSI
Pengesanan Ayunan Adaptif
Penunjuk menggunakan kaedah pelicinan berasaskan regresi untuk menapis bunyi pasaran dan mengenal pasti titik ayunan sebenar — saat di mana harga komited kepada perubahan arah, bukan sumbu rawak.
Tiga mod pengesanan tersedia:
- Utama — Hanya pembalikan yang disahkan dan berkeyakinan tinggi
- Standard — Semua struktur ayunan utama
- Minor — Termasuk ayunan dalaman untuk analisis terperinci
Pemetaan Zon Nombor Bulat
Titik ayunan dipetakan secara automatik ke tahap harga psikologi. Jarak zon menyesuaikan dengan volatiliti instrumen anda berdasarkan kedalaman ayunan purata — tiada konfigurasi manual diperlukan.
Tetapkan pengganda ke sifar dan penunjuk mengira jarak optimum secara automatik.
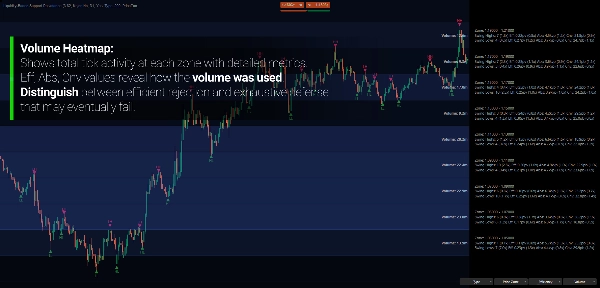
Metrik Kecairan
Di setiap zon, penunjuk mengira:
- Kedalaman — Sejauh mana harga bergerak dari titik ayunan (dalam pips)
- Volum — Jumlah aktiviti tick semasa ayunan
- Kecekapan — Pergerakan harga per unit volum (mengukur kecekapan pelaksanaan)
- Penyerapan — Volum yang diperlukan untuk menahan pergerakan harga (usaha untuk mengekalkan tahap)
- Keyakinan — Pergerakan harga per bar (momentum dan komitmen)
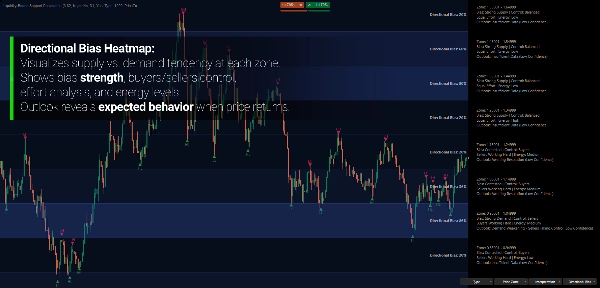
Analisis Arah
Setiap zon dianalisis untuk:
- Bias — Adakah ini zon bekalan (lebih banyak ayunan tinggi) atau zon permintaan (lebih banyak ayunan rendah)?
- Kawalan — Adakah pembeli atau penjual beroperasi dengan lebih cekap di sini?
- Tenaga — Berapa banyak aktiviti keseluruhan berbanding garis dasar?
Metrik ini digabungkan untuk menghasilkan tafsiran dalam bahasa mudah tentang apa yang berlaku di setiap tahap.
CIRI UTAMA
Mod Label Pelbagai
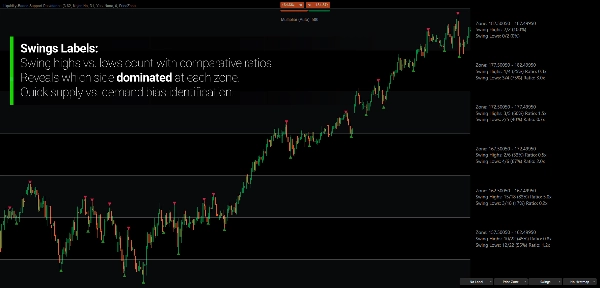
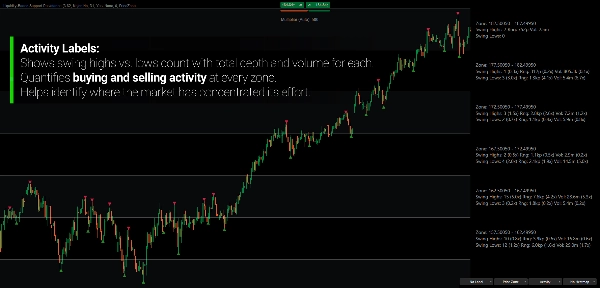
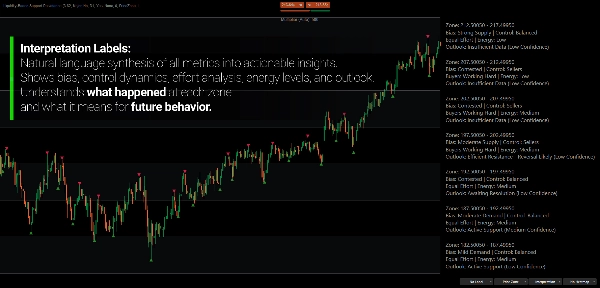
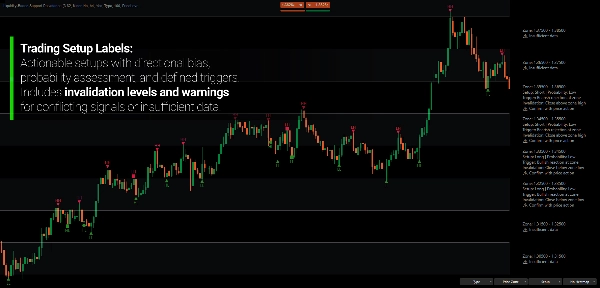
- Harga — Pengenalan zon mudah
- Ayunan — Kiraan ayunan tinggi vs. rendah dengan nisbah
- Aktiviti — Kedalaman, volum, dan nisbah perbandingan
- Kecekapan — Metrik yang dikira menunjukkan ketepatan institusi
- Tafsiran — Analisis bahasa semula jadi tentang bias, kawalan, dan pandangan
- Persediaan — Persediaan dagangan yang boleh diambil tindakan dengan pencetus, pembatalan, dan kebarangkalian
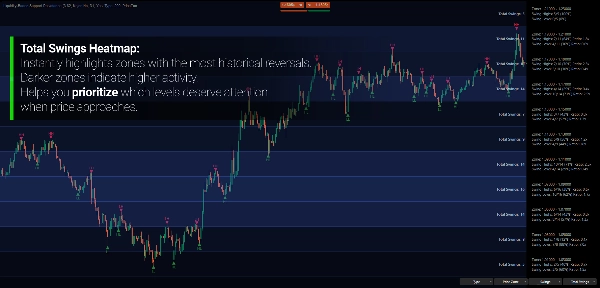
Visualisasi Peta Haba
Menukar data mentah menjadi pandangan visual segera. Peta haba mengekod mana-mana metrik di semua zon yang kelihatan menggunakan gradien warna tiga titik — sejuk, sederhana, panas.
Daripada membaca nombor di setiap tahap, anda melihat corak dengan sekilas pandang:
- Di mana volum tertumpu?
- Zon mana yang menunjukkan bias arah yang kuat?
- Di mana kecekapan paling tinggi?
- Tahap mana yang menyerap usaha paling banyak?
17 mod peta haba tersedia:
- Aktiviti — Jumlah Ayunan, Ayunan Tinggi, Ayunan Rendah
- Nisbah — Nisbah Tinggi/Rendah, Nisbah Kedalaman, Nisbah Volum, Nisbah Tempoh
- Metrik Mentah — Kedalaman, Volum
- Dikira — Kecekapan, Penyerapan, Keyakinan, Bias Arah
Analisis Pelbagai Jangka Masa
Menganalisis struktur ayunan jangka masa lebih tinggi sambil melihat tindakan harga jangka masa lebih rendah. Lihat aktiviti ayunan Harian dipetakan ke zon H1 tanpa menukar carta.
Mod Paparan Berganda
- Tahap Harga — Garis tunggal tradisional pada nombor bulat
- Zon Harga — Batas atas dan bawah menunjukkan lebar zon penuh
Jarak Zon Adaptif
Tetapkan pengganda ke sifar dan penunjuk secara automatik mengira lebar zon optimum berdasarkan kedalaman ayunan purata instrumen anda. Berfungsi merentas forex, indeks, kripto, dan komoditi tanpa penyetelan manual.
MOD TAFSIRAN & PENYEDIAAN
Penunjuk ini bukan sahaja menunjukkan data — ia mensintesis metrik menjadi analisis yang boleh anda bertindak.
Mod tafsiran menyediakan:
- Penilaian bias (Bekalan atau Permintaan Kuat/Sederhana/Ringan)
- Pengenalpastian kawalan (Pembeli, Penjual, atau Seimbang)
- Analisis usaha (siapa yang bekerja lebih keras untuk mengekalkan posisi)
- Tahap tenaga (Tinggi/Sederhana/Rendah berbanding garis dasar)
- Pernyataan pandangan yang menerangkan tingkah laku yang mungkin
Mod penyediaan melangkah lebih jauh:
- Bias arah (Panjang, Pendek, atau Neutral)
- Syarat pencetus kemasukan
- Kriteria pembatalan
- Penilaian kebarangkalian (Tinggi/Sederhana/Rendah/Sangat Rendah)
- Amaran apabila isyarat bertentangan
Contoh output:
"Persediaan: Panjang | Kebarangkalian: Sederhana" "Pencetus: Pecah dan tutup di atas zon" "Pembatalan: Tutup kembali di bawah zon"
MEMBACA ZON
Zon Bekalan — Lebih banyak ayunan tinggi daripada rendah. Harga cenderung berbalik ke bawah di sini. Penjual secara sejarah mempertahankan tahap ini.
Zon Permintaan — Lebih banyak ayunan rendah daripada tinggi. Harga cenderung berbalik ke atas di sini. Pembeli secara sejarah mempertahankan tahap ini.
Zon Dipertikaikan — Anggaran ayunan tinggi dan rendah yang sama rata. Tiada bias arah yang jelas. Selalunya menghasilkan pergerakan meletup apabila diselesaikan.
Tenaga Tinggi — Penyerapan volum yang signifikan berbanding garis dasar. Tahap ini dipertahankan secara aktif.
Tenaga Rendah — Aktiviti minimum. Tahap mungkin mudah pecah atau hanya diabaikan.
Ketidakseimbangan Kecekapan — Apabila satu pihak menggerakkan harga lebih jauh per unit volum, mereka mengawal tanpa mengira siapa yang berusaha lebih keras.
SIAPA YANG SESUAI
Penunjuk ini direka untuk pedagang yang mahukan konteks di sebalik tahap mereka, bukan hanya garis pada carta.
Ia sesuai untuk pedagang berasaskan struktur yang menggabungkan konsep seperti analisis volum, usaha vs. hasil, atau dinamik bekalan/permintaan dalam membuat keputusan mereka.
Pedagang ayunan dan posisi akan mendapat manfaat dengan melihat tahap mana yang membawa berat institusi sebelum merancang kemasukan di sekelilingnya.
Penganalisis pelbagai jangka masa boleh melihat struktur kecairan jangka masa lebih tinggi terus pada carta pelaksanaan.
Ini bukan penjana isyarat. Ia adalah rangka kerja kontekstual untuk memahami apa yang telah dilakukan pasaran pada tahap harga utama — dan apa yang itu cadangkan tentang tingkah laku masa depan.
APA YANG MEMBEZAKANNYA
Kebanyakan penunjuk sokongan dan rintangan menjawab: "Di mana harga berbalik?"
Penunjuk ini menjawab: "Apa yang berlaku apabila harga berbalik di sana, dan apa yang itu beritahu kita?"
Dengan mengkuantifikasi aktiviti di setiap tahap — bukan hanya menandakan di mana ayunan berlaku — anda mendapat pandangan tentang:
- Sama ada tahap itu mungkin bertahan atau pecah
- Pihak mana yang beroperasi dengan lebih cekap
- Sama ada tenaga sedang dibina untuk pecahan atau keletihan
- Bagaimana untuk menyusun dagangan di sekitar tahap dengan pencetus dan pembatalan yang ditakrifkan
Analisis menyesuaikan dengan instrumen anda secara automatik. Tiada pengoptimuman diperlukan — struktur pasaran menentukan parameter.
---
MEMAHAMI KECAIRAN DI TAHAP HARGA
Sokongan dan rintangan bukan garis ajaib di mana harga memantul. Ia adalah zon di mana kepentingan bertentangan tertumpu.
Di tahap sokongan, pembeli secara sejarah sanggup menyerap tekanan jualan. Di rintangan, penjual telah menyerap tekanan pembelian. Kekuatan tahap bergantung bukan pada berapa kali ia disentuh, tetapi pada berapa banyak yang diperlukan untuk menahannya — dan sama ada pertahanan itu kekal utuh.
Inilah sebabnya dua tahap dengan sejarah harga yang sama boleh berkelakuan sangat berbeza. Satu mungkin telah menyerap volum yang besar untuk bertahan — mencadangkan keletihan akhirnya. Satu lagi mungkin telah menolak harga dengan mudah — mencadangkan keyakinan yang kuat.
Penunjuk yang dibina berdasarkan konsep ini tidak meramalkan ke mana harga akan pergi. Ia membantu anda memahami apa yang telah berlaku di tahap utama, supaya anda boleh membuat keputusan yang lebih baik apabila harga kembali.
---
Nota: Penunjuk ini memodelkan dinamik kecairan melalui volum tick dan interaksi harga — bukan data buku pesanan langsung. Walaupun volum tick mewakili aktiviti peringkat broker dan bukan volum pertukaran, ia secara boleh dipercayai menunjukkan tahap penyertaan relatif dan berkorelasi dengan corak volum pasaran sebenar.
Perdagangan melibatkan risiko. Penunjuk ini adalah alat analisis teknikal—sentiasa gunakan pengurusan risiko yang betul.


