Beschreibung
Die meisten Trendindikatoren beantworten dieselbe Frage auf dieselbe Weise: den Preis glätten, einige Linien zeichnen, nach Kreuzungen suchen. Der FDQ Price Channel wurde um eine andere Frage herum entwickelt — was der Preis tatsächlich tut, befreit von Rauschen und Drift, und was das darüber aussagt, wohin er wahrscheinlich gehen wird?
Das Ergebnis ist ein trendbasierter Kanalindikator, der drei verschiedene analytische Ebenen zu einer einzigen, lesbaren Überlagerung kombiniert.
- Wichtige Punkte
Ein anderer Ausgangspunkt. Die Preisdaten, die die meisten Indikatoren verwenden, sind statistisch gesehen problematisch.
Rohpreise enthalten eine Komponente des zufälligen Gehens, die bedeutungsvolle Strukturen verschleiert. Bevor ein Kanal gezeichnet wird, wendet FDQ eine fraktionale Differenzierungstransformation an — eine Technik aus der quantitativen Forschung — die diese Drift entfernt und gleichzeitig absichtlich das Langzeitgedächtnis in den Daten bewahrt. Was bleibt, ist eine transformierte Serie, die immer noch widerspiegelt, wo der Markt gewesen ist, aber nicht mehr von seinem aktuellen Stand dominiert wird. Dies ist die Grundlage, auf der alles andere aufbaut.
- Rauschen hat seinen Preis
Jede glättende Methode mit Verzögerung tauscht Timing gegen Genauigkeit. Kalman-Filter tun das nicht.
Der Kalman-Filter ist ein rekursiver Schätzprozess: Er aktualisiert kontinuierlich seine Sicht auf den Markt und balanciert ab, wie sehr den neuen Daten vertraut wird im Vergleich zu dem, was bereits etabliert wurde. Im Gegensatz zu einem gleitenden Durchschnitt hat er kein festes Rückblickfenster und behandelt nicht alle vergangenen Bars gleich. Das Ergebnis ist eine sauberere Darstellung des Preises, die schnell auf echte Bewegungen reagiert und widersteht, auf Rauschen zu reagieren — ohne die verzögerten Signale, die Glättung typischerweise erzeugt.
- Bänder basieren auf Verhalten, nicht auf Formeln
Standardabweichungsbänder setzen voraus, dass der Preis normalverteilt ist. Das ist er selten.
Die FDQ-Kanalgrenzen werden mittels Quantilanalyse definiert — der tatsächlichen statistischen Verteilung des transformierten Preises über den Rückblickzeitraum. Das obere Band markiert das Niveau, das die Serie am oberen Extrem ihres Bereichs tatsächlich erreicht; das untere Band tut dasselbe am unteren Extrem. Dies sind keine theoretischen Grenzen, die aus einem Mittelwert berechnet werden — sie spiegeln wider, wo der Preis tatsächlich gehandelt wurde, was sie reaktionsfähiger macht gegenüber dem tatsächlichen Verhalten des Marktes zu jedem Zeitpunkt.
- Eine zweite Ebene innerhalb des Kanals
Die äußeren Bänder definieren den Bereich. Die inneren Bänder definieren die Zone.
Ein zweites Satz von Bändern liegt proportional zwischen dem äußeren Kanal und seiner Mittellinie. Diese innere Ebene schafft eine deutliche Handelszone — schmaler als der volle Kanal, verankert auf derselben statistischen Grundlage — die als abgestufte Referenz für Einstiege und Signalklassifikation dient.
- Trendzustand vor allem anderen
Ein Signal ohne Kontext ist nur zufällige Daten.
Der Indikator verfolgt den Richtungszustand des Kanals kontinuierlich, indem er einen Mehrheitsentscheidungsmechanismus über die drei Bandkomponenten verwendet. Wenn mindestens zwei der drei sich in dieselbe Richtung bewegen, wird der Trendzustand als Steigend oder Fallend bestätigt. Signale werden nur in Übereinstimmung mit dem aktuellen Zustand generiert — Long-Setups nur bei steigenden Bedingungen, Short-Setups nur bei fallenden. Wenn der Markt diese Schwelle nicht erreicht, wird kein Zustand erklärt und keine Signale generiert. Die Übergänge zwischen Zuständen werden als vertikale Linien direkt im Chart markiert.
- Drei unterschiedliche Rebound-Setups
Nicht alle Rücksetzer sind gleich. Der Indikator erkennt drei Abstufungen.
Sobald ein Trendzustand aktiv ist, beobachtet der Indikator spezifische Rebound-Muster — Momente, in denen der Preis gegen den Trend gelaufen ist, ein definiertes Niveau berührt hat und wieder zurückgekehrt ist.
-
- Mittlerer Rebound — Der Preis fällt unter (oder steigt über) die Mittellinie des Kanals und erholt sich. Ein standardmäßiger Rücksetzer innerhalb eines Trends.
- Tiefer Rebound — Der Preis geht weiter, erreicht das innere Bandextrem, bevor er sich erholt. Ein stärkerer Rücksetzer mit einer entschlosseneren Umkehr.
- Leichter Rebound — Der Preis berührt das innere Band auf der Trendseite und schnellt zurück. Der flachste der drei, am häufigsten vorkommend.
Jeder Typ ist im Chart visuell unterscheidbar und kann unabhängig ein- oder ausgeschaltet werden.
- Was Sie sehen
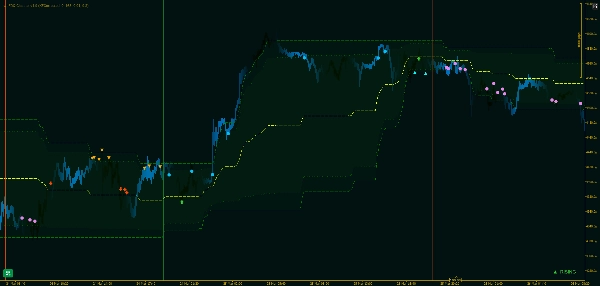
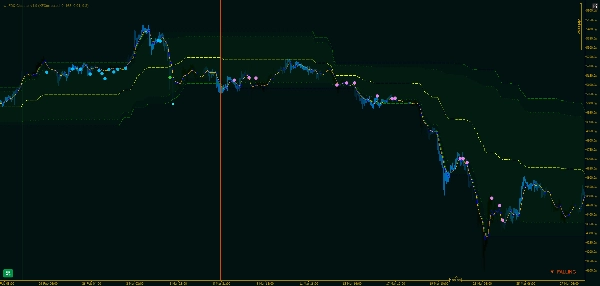
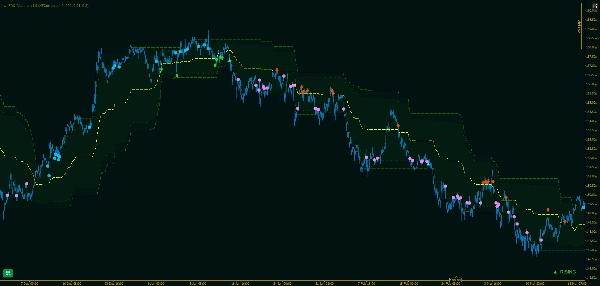
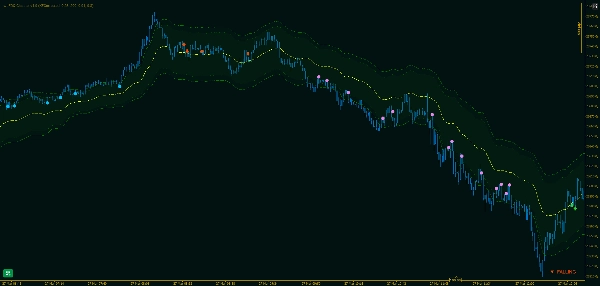
Das Chart erzählt die Geschichte direkt, ohne Interpretation.
Der primäre Kanal, die inneren Bänder und die Mittellinie überlagern den Preis als durchgehende Linien. Regimewechsel sind mit vertikalen Linien markiert — grün für Steigend, rot für Fallend — sodass die Historie der Trendzustandsänderungen auf einen Blick sichtbar ist. Signalmarker erscheinen an der Bar, an der jeder Rebound bestätigt wird, mit separaten Symbolen für jeden Signaltyp und jede Richtung.
- Warum dieser Ansatz Bestand hat
Die meisten Kanalindikatoren hinken hinterher, wenn sich Märkte schnell bewegen, und überreagieren, wenn sie es nicht tun.
Weil der FDQ-Kanal auf einer stationären, speichererhaltenden Transformation basiert und nicht auf einem gleitenden Durchschnitt, passen sich die Bänder an die Verteilung des tatsächlichen Verhaltens an, anstatt dem Preis hinterherzulaufen. Die Kalman-Ebene hält die zugrundeliegende Schätzung sauber, ohne die zeitliche Verzögerung einzuführen, die mit fensterbasierter Glättung einhergeht. Das Ergebnis ist ein Kanal, der unter verschiedenen Marktbedingungen — Trend, Seitwärtsbewegung und Übergang — sinnvoll bleibt, ohne manuelle Anpassung zu benötigen.
Zusammenfassung
The channel boundaries are defined by quantile analysis of the transformed price distribution rather than standard deviation, capturing actual price extremes over the lookback period. It features outer bands marking the full range and inner bands creating a narrower trading zone for refined entry signals. The indicator continuously tracks trend direction using a majority vote across three band components, confirming Rising or Falling states and marking transitions with vertical lines on the chart.
Within active trends, wt.FDQ Channel identifies three distinct rebound setups—Light, Mid, and Deep—each representing different pullback intensities and reversal confirmations. These signals are visually distinct and configurable. The overlay displays the primary channel, inner bands, midline, trend states, and rebound signals directly on the price chart, supporting analysis across various markets including Forex, indices, and cryptocurrencies.
Kundenbewertungen
5 | 100 % | |
4 | 0 % | |
3 | 0 % | |
2 | 0 % | |
1 | 0 % |


