present
Registrati e ricevi uno sconto da $50 sul tuo primo acquisto
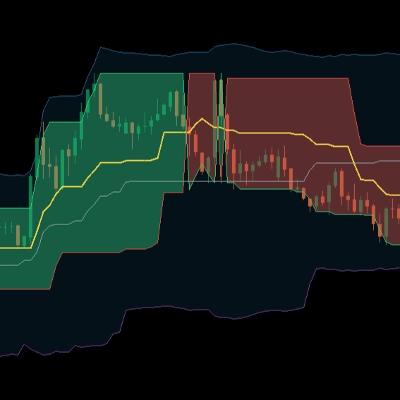
Trading product for Fisher Oscillator Indicatore EMA Market Structure, image 1
Fisher Oscillator
Indicatore
Versione 1.0, May 2026
Windows, Mac
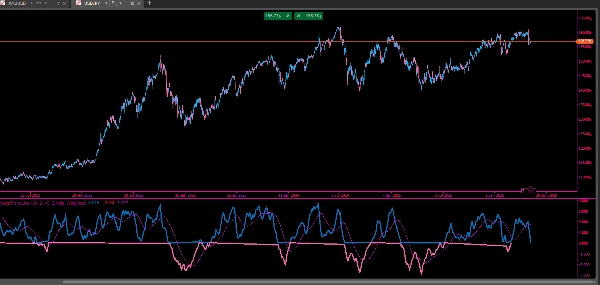
Trading product for Fisher Oscillator Indicatore EMA Market Structure, image 2
Da 21/02/2025
466.3M
Volume negoziato
180.83K
Profitto in pip
26
Vendite
7.44K
Installazioni gratuite

Descrizione

Questo indicatore è una versione modificata del Fisher Transform progettata per cTrader. Converte i dati di prezzo in un oscillatore normalizzato che evidenzia potenziali punti di svolta nel mercato.

Calcola un Fisher Transform smussato basato sul prezzo medio (media di massimo e minimo) su un periodo configurabile. La trasformazione enfatizza i movimenti di prezzo estremi, rendendo più facile identificare massimi e minimi.

Per ridurre il rumore, i valori grezzi del Fisher sono ulteriormente smussati utilizzando due medie mobili con periodi e tipi configurabili. L'indicatore separa anche i valori positivi e negativi del Fisher in due grafici colorati diversamente (verde e rosso), migliorando la chiarezza visiva attorno alla linea zero.

Inoltre, una linea di segnale (gialla) è tracciata usando la seconda media mobile, aiutando i trader a identificare più chiaramente la direzione del trend e i cambiamenti di momentum.

In generale, questo indicatore è utilizzato per rilevare inversioni, evidenziare condizioni di ipercomprato/ipervenduto e fornire una conferma del trend più fluida attraverso una media stratificata.

Riepilogo

AI summary
The Fisher Oscillator is a modified version of the Fisher Transform indicator designed for the cTrader platform. It converts price data into a normalized oscillator that highlights potential market turning points by emphasizing extreme price movements. The calculation is based on a smoothed Fisher Transform of the midpoint price (average of high and low) over a configurable period.

To reduce noise, the indicator applies two moving averages with customizable periods and types to smooth the raw Fisher values. It visually separates positive and negative Fisher values into green and red plots, respectively, enhancing clarity around the zero line. Additionally, a yellow signal line derived from the second moving average helps identify trend direction and momentum shifts.

This indicator is primarily used to detect market reversals, highlight overbought and oversold conditions, and provide smoother trend confirmation through layered averaging. It supports trend and market structure analysis and outputs visual signals suitable for bar-based price data.

Profilo indicatore
Categoria indicatore
Trend
Tipo di output
Visualizzazione
Requisiti per i dati
Solo barre
Segnali supportati
Forza del trend
Inversione

Recensioni dei clienti

0.0
Recensioni: 0
Recensioni dei clienti
Questo prodotto non ha ancora ricevuto recensioni. L'hai già provato? Fallo sapere agli altri per primo!

Discussioni

Domande frequenti

EMA
Market Structure
Moving Average
I prodotti disponibili tramite cTrader Store, inclusi bot di trading, indicatori e plugin, sono forniti da sviluppatori terzi e resi disponibili esclusivamente a scopo informativo e di accesso tecnico. cTrader Store non è un broker e non fornisce consulenze in materia di investimento, raccomandazioni individualizzate o garanzie di risultati futuri.

Altro da questo autore

Indicatore
RSI
Forex
+4
High-probability trading signals in the fast-paced world of forex and CFD trading.
Indicatore
Prop
Stocks
+4
High-Performance Renko Chart Indicator with Advanced filtering method - built for Renko and candlestick charts.
Indicatore
ATR
MSS
+5
Detects ICT Turtle Soup setups — liquidity sweeps with MSS confirmation, ATR filter & kill zone session filter.
Indicatore
SMC
Prop
+15
Automatic Elliott Wave Detection with Professional Filters
Indicatore
Fibonacci
Key Levels
DailyTargets: Dynamic ADR-based levels & targets. Includes Buy/Sell zones, previous Hi/Lo, and automated trend alerts.
Indicatore
EMA
RSI
+2
Advanced TDI indicator with Shark Fin signals, chart arrows, MTF RSI, divergence detection and smart alerts.
Indicatore
Key Levels
Order Block
+3
Marks NY session range, detects wick sweeps beyond box edges.. One signal per day. Overlay, no repainting!
Indicatore
MACD
Key Levels
+2
Trend indicator with multi-timeframe filters, generating signals only on fully completed bricks & candles. No Repaint.
Indicatore
Key Levels
Supertrend
+3
Marks London and New York session opening zones and alerts you instantly on breakouts.
cBot
EMA
SL Manager
+5
Fully automated dual-symbol hedging cBot for cTrader.
20.6%
ROI
8.66
Fattore di profitto
Indicatore
BOS
Fair Value Gap
+1
ICT Quarterly Theory indicator — color-coded Q1–Q4 session zones with smart entry signals and real-time alerts.
cBot
RSI
Aggressive
automates entries based on the RSX indicator — a smoothed, low-lag variant of the classic RSI.
1.67
Fattore di profitto

Potrebbe interessarti anche

Indicatore
Indices
this indicator shows previous day high low and closed with precise manner.
Indicatore
Prop
Forex
+4
Pivot Points Standard — All-in-One Multi-Timeframe Pivot Indicator for cTrader
Indicatore
Market session indicator (Asia, Frankfurt, New York, London)
Indicatore
Volume
Custom range volume profile between two draggable anchors. Auto source timeframe, Total/Up-Down/Delta, POC, Value Area.
Indicatore
SMC
Forex
+5
MMXM Structure by LudwigICT – Professional Market Structure Mapping Tool
Indicatore
Indices
Breakout
+1
You can use the cTrader Pivot Points Pro indicator to find a good pullback entry in a trend
Indicatore
ATR
BOS
+5
Full ICT/SMC 4-step setup checker that alerts a long or short setup.
Indicatore
VWAP
Forex
+12
Unlock VWAP in cTrader! Choose anchor periods, price sources, and display deviation bands with real-time tick updates.
Indicatore
ATR
Trend-coloring Donchian cloud that highlights volatility squeezes and breakouts.
Indicatore
Breakout
PDHL - Previous Day High&Low
Logo di "supertrend"
Popolare
4.3
(3)
$20
Indicatore
ATR
Prop
+4
Supertrend Indicator
Indicatore
SMC
VWAP
+5
Most advanced Volume Profile Pivot Box indicator — auto pivots, volume zones, smart candle coloring & SMC trading tool.
Indicatore
ATR
RSI
+4
VWAP with ATR ribbon bands and RSI labels on completed breakouts — live forming labels on cTrader.
Indicatore
Liquidity Grab
Liquidity Sweep
+1
CRT Sweep Tracker is an advanced panel for Candle Range Theory (CRT) traders to track HTF sweeps and manage live trades.
Indicatore
MSS
Volume
+3
Rejection-based volume profile with tiered heat zones, POC levels and a fully draggable anchor on cTrader.
Indicatore
ATR
Prop
+7
Smart momentum tool uses advanced filtering and colour cues for clearer market direction and trading signals.
Indicatore
ATR
RSI
+4
RSI bands drawn on price, confluence-scored BUY/SELL signals, an ATR stop with three targets
Indicatore
Signal
Stocks
+5
🚀 Automated Elliott Wave & Fibonacci tool for cTrader. Spot trends, corrections & retracements fast.

Prezzo

Da 21/02/2025
466.3M
Volume negoziato
180.83K
Profitto in pip
26
Vendite
7.44K
Installazioni gratuite