Penerangan
Penunjuk Bacaan Pita: Berdasarkan aliran susunan bacaan secara masa nyata.
Maklumat mengikut Garis Harga:
HARGA: Nilai tepat tahap harga.
VOL↑ dan VOL↓: Nombor mentah yang menunjukkan berapa banyak tik agresif (beli atau jual) berlaku pada harga itu dalam tetingkap analisis.
Bar (◄ BID dan ASK ►): Bar lebar berubah yang memudahkan perbandingan visual volum. Semakin lebar bar, semakin besar volum.
BIDS / ASKS (disimulasikan): Nilai yang dijana oleh penunjuk untuk mensimulasikan kecairan, berdasarkan harga semasa.
Sorotan Visual: Kod menggunakan warna dan simbol khas untuk peristiwa penting:
Harga Semasa (BID/ASK): Garis Harga Bid bertukar biru gelap, dan garis Ask bertukar merah gelap.
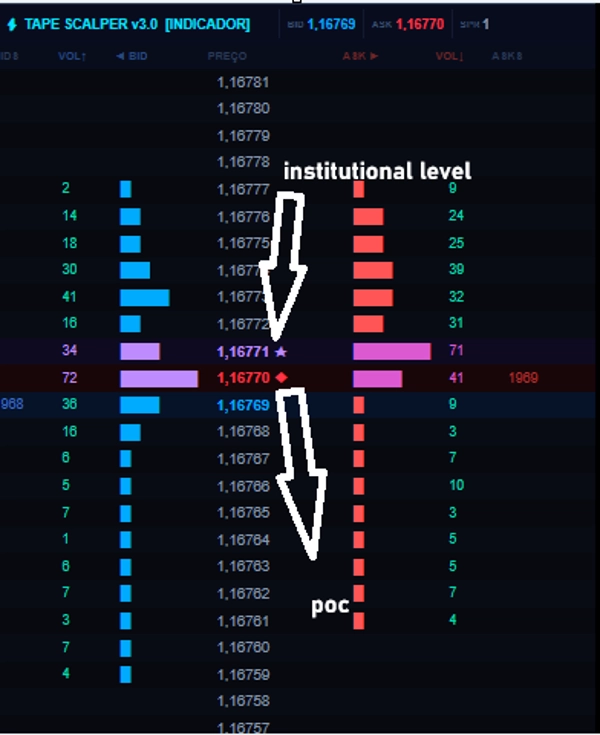
◆ (Berlian): Menunjukkan POC (Titik Kawalan) – tahap harga dengan volum terkumpul tertinggi dalam tempoh tersebut.
★ (Bintang): Menunjukkan bahawa volum pada tahap itu adalah Institusi (melebihi ambang yang ditetapkan).
← (Anak Panah): Menunjukkan bahawa harga semasa berada di had had Julat (Atas atau Bawah) yang ditetapkan untuk strategi Pecahan.
Warna Bar dan Nombor:
Sian / Biru Muda: Volum Beli Normal.
Merah / Merah Jambu: Volum Jual Normal.
Hijau / Kuning: Volum sangat tinggi (HiVol).
Ungu / Lilac: Volum yang diklasifikasikan sebagai Institusi.
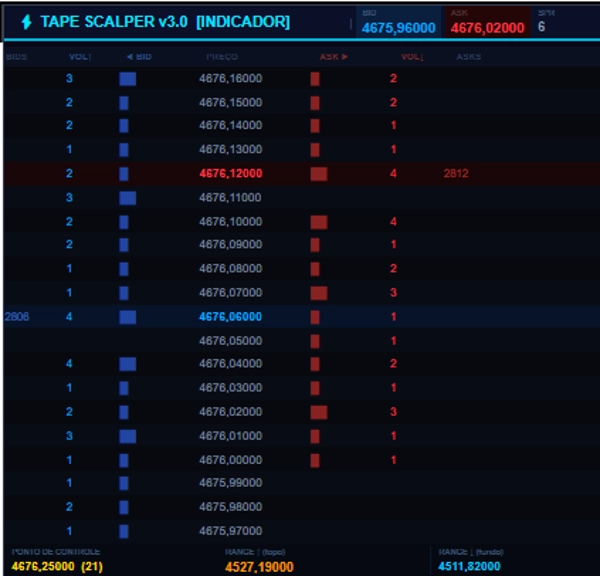
4. STATSROW (Baris Statistik Bawah)
Memaparkan tiga metrik kontekstual penting untuk analisis bacaan pita.
Nama Kod Metrik Maksudnya
TITIK KAWALAN POC Tahap harga dengan jumlah volum terkumpul tertinggi (jumlah beli dan jual). Memaparkan harga dan jumlah volum
JULAT↑ (atas) Julat Tinggi Harga tertinggi dalam julat yang ditetapkan oleh tempoh bar (contohnya, 20 bar terakhir).
JULAT↓ (bawah) Julat Rendah Harga terendah dalam julat yang ditetapkan oleh tempoh bar.
Ringkasan untuk Portfolio Penjualan
Apabila membentangkan penunjuk ini sebagai produk, anda harus menonjolkan maklumat berikut yang hanya boleh dilihat pada papan pemuka:
Visualisasi Aliran Pesanan Masa Nyata: Lihat pertarungan antara pembeli dan penjual tahap demi tahap.
Pengenalpastian Tahap Institusi (★): Membezakan "wang pintar" daripada runcit terus pada tangga harga.
Titik Kawalan Dinamik (POC) (◆): Ketahui dengan tepat di mana volum sedang tertumpu pada masa ini.
Pengesanan Pecahan Visual (←): Lihat pada tangga itu sendiri apabila harga menyentuh tepi julat yang telah ditetapkan.
COBA VERSI PRO: https://ctrader.com/products/4282
Ringkasan
Key features include simulated bid and ask liquidity values, visual highlights for important events, and color-coded volume bars: cyan/light blue for normal buy volume, red/pink for normal sell volume, green/yellow for exceptionally high volume, and purple/lilac for institutional volume. Special symbols mark the Point of Control (◆) representing the price level with the highest accumulated volume, institutional volume levels (★), and breakout range limits (←).
A lower statistics row provides contextual metrics such as the Point of Control (POC), Range High (RANGE↑), and Range Low (RANGE↓) over the selected bar period. The indicator supports visualization of institutional activity and breakout detection directly on the price ladder, aiding in detailed tape reading and volume-based market analysis. It requires tick data and outputs visual signals including level touches, breaks, and reversals.