
الوصف
https://chartshots.spotware.com/c/695bff3f3bc21
https://chartshots.spotware.com/c/695bffac03fb1
https://chartshots.spotware.com/c/695c0002aabb7
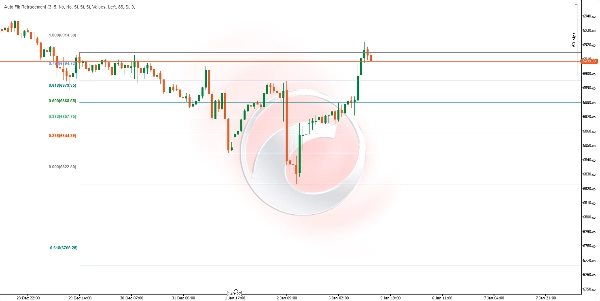
📊 تراجع فيبوناتشي التلقائي
تراجع فيبوناتشي التلقائي هو مؤشر تحليل فني يقوم برسم مستويات تراجع وتمديد فيبوناتشي تلقائيًا استنادًا إلى أحدث تحركات سعرية هامة. على عكس أدوات فيبوناتشي اليدوية، يكتشف هذا المؤشر نقاط التحول في السوق تلقائيًا ويحدث المستويات في الوقت الحقيقي.
⚙️ كيف يعمل؟
الكشف التلقائي عن النقاط المحورية
يستخدم المؤشر خوارزمية ZigZag ديناميكية لتحديد أعلى وأدنى الأسعار الهامة:
- النظر للخلف (العمق): يحدد عدد الأشرطة التي يتم تحليلها للخلف لتأكيد نقطة محورية. القيمة الأعلى تكشف عن تقلبات أكبر؛ والقيمة الأقل أكثر حساسية للحركات الصغيرة.
- الحساسية (الانحراف): تتحكم في مدى أهمية حركة السعر لتشكيل نقطة محورية جديدة. يتم حسابها بضرب متوسط المدى الحقيقي (ATR) لفترة 10 بهذا العامل. القيم الأعلى تصفي الضوضاء وتكشف فقط عن الحركات المهمة.
حساب مستويات فيبوناتشي
بمجرد تحديد آخر نقطتين محوريتين (عالية ومنخفضة)، يحسب المؤشر كل مستوى باستخدام صيغة فيبوناتشي الكلاسيكية:
المستوى = سعر المرجع + (نطاق الحركة × نسبة فيبوناتشي)
حيث:
- سعر المرجع: سعر النقطة المحورية الأخيرة (أو السابقة إذا تغير الاتجاه)
- نطاق الحركة: الفرق بين النقطتين المحوريتين
- النسب المتاحة: 0, 0.236, 0.382, 0.5, 0.618, 0.65, 0.786, 1, 1.272, 1.414, 1.618, 1.65, 2.618, 2.65, 3.618, 3.65, 4.236, 4.618, والمستويات السالبة (-0.236, -0.382, -0.618, -0.65)
📈 ما الغرض منه؟
UseDescription
تحديد الدعم والمقاومة
المستويات 0.382, 0.5, و 0.618 هي مناطق كلاسيكية حيث يميل السعر إلى التفاعل 🔵
تحديد أهداف السعر
مستويات التمديد (1.618, 2.618, 3.618, 4.236) تساعد في توقع مدى الحركة 🎯
تخطيط نقاط الدخول
ابحث عن ارتدادات إلى المستويات الرئيسية للدخول في اتجاه الاتجاه ⬆️⬇️
تعيين وقف الخسارة
ضع أوامر الوقف خلف مستويات فيبوناتشي ذات الصلة 🛑
تأكيد مناطق الانعكاس
عندما يصل السعر إلى مستويات التمديد القصوى، قد يشير ذلك إلى النفاد 🔄
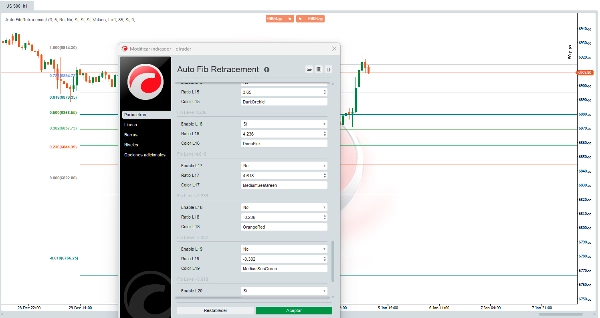
🛠️ كيفية استخدامه
المعلمات الرئيسية
وصف المعلمة القيمة المقترحة
الحساسية
مضاعف الانحراف لتصفية الحركات الطفيفة
3 (افتراضي)
النظر للخلف
الحد الأدنى لعدد الأشرطة لحساب النقاط المحورية
10 (افتراضي)
عكس الاتجاه
يعكس نقطة المرجع لحساب المستوى
معطل
خيارات العرض
الخيار الوظيفة
تمديد لليسار / اليمين
يمدد الخطوط الأفقية إلى يسار أو يمين الرسم البياني
عرض الأسعار
يعرض السعر الدقيق لكل مستوى
عرض النسب
يعرض نسبة فيبوناتشي (قيم أو نسبة مئوية)
موضع العلامة
يضع التسميات إلى اليسار أو اليمين
شفافية المنطقة
يتحكم في شفافية المناطق الملونة بين المستويات
مستويات فيبوناتشي قابلة للتكوين
يمكن لكل من المستويات الـ 22 أن تكون:
- مفعلة أو معطلة بشكل فردي
- يتم تعديل قيمتها الرقمية
- يتم تغيير لونها
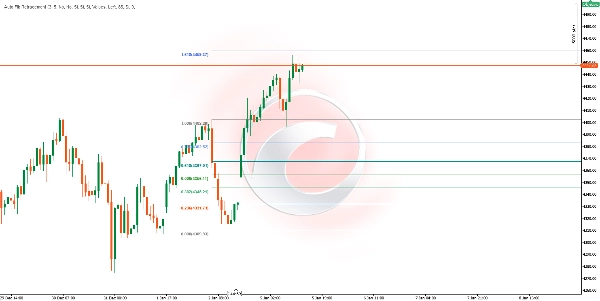
💡 تفسير المناطق
تسهل المناطق الملونة بين المستويات المتتالية التعرف البصري:
- المناطق الخضراء/الزرقاء (0.382 - 0.786): منطقة ارتداد صحي في الاتجاهات. منطقة شائعة للبحث عن نقاط الدخول. ✅
- منطقة المستوى 1.0: تمثل 100% من الحركة السابقة. تعمل كمستوى دعم/مقاومة رئيسي. ⚖️
- المناطق الحمراء/الوردية (1.618+): تمديدات الحركة. قد يشير وصول السعر إلى هذه المناطق إلى تمدد مفرط. ⚠️
⚠️الاعتبارات
- يقوم المؤشر بالتحديث تلقائيًا عند اكتشاف نقاط محورية جديدة مهمة
- يعمل على أي إطار زمني وأصل مالي
- مستويات فيبوناتشي هي مناطق احتمالية وليست ضمانات
- يوصى باستخدامها بالتزامن مع مؤشرات أخرى أو تحليل حركة السعر
- في الأسواق المتذبذبة أو المتقلبة، قد تتغير النقاط المحورية بشكل متكرر
📝 ملاحظات فنية
- يتم استخدام متوسط المدى الحقيقي (ATR) لفترة 10 داخليًا لحساب العتبة الديناميكية للكشف عن النقاط المحورية
- يتطلب المؤشر وجود بيانات تاريخية لا تقل عن ضعف قيمة معلمة النظر للخلف ليعمل بشكل صحيح
- يتم إعادة رسم الخطوط والمناطق فقط على الشمعة الأخيرة لتحسين الأداء 🚀
الملخص
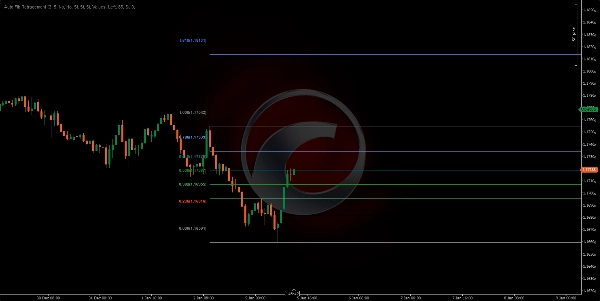
The indicator helps traders identify potential support and resistance zones, define price targets, plan entries on pullbacks, set stop-losses beyond key levels, and confirm reversal zones when price reaches extreme extensions. It works on any timeframe and financial asset, including Forex, stocks, commodities, indices, and cryptocurrencies such as BTCUSD, EURUSD, GBPUSD, XAUUSD, NAS100, and others.
Users can customize parameters like sensitivity, lookback period, direction inversion, and display options (line extension, price and ratio labels, zone opacity, and colors). Colored zones visually highlight key Fibonacci areas for easier interpretation. The indicator updates automatically with new pivots and redraws levels on the latest bar to optimize performance.


![شعار "[Stellar Strategies] Market Session Ultimate"](https://cdn.ctrader.com/image/webp/61ffd537-0125-4246-9e72-42eca1791d64_28232)


![شعار "[CB] Pivot Points Pro"](https://cdn.ctrader.com/image/webp/43463c82-67b0-4f10-a4ba-901bba091d81_32594)


