
Descrição
Sistema de Trailing Adaptativo 🚀
O Sistema de Trailing Adaptativo é um trailing stop adaptativo avançado que utiliza volatilidade normalizada logarítmica para ajustar automaticamente os níveis de proteção de lucro. 📊 Diferente dos trailing stops tradicionais com distâncias fixas, este sistema calcula distâncias dinâmicas baseadas na volatilidade real do mercado, adaptando-se constantemente às condições mutáveis. 🔄
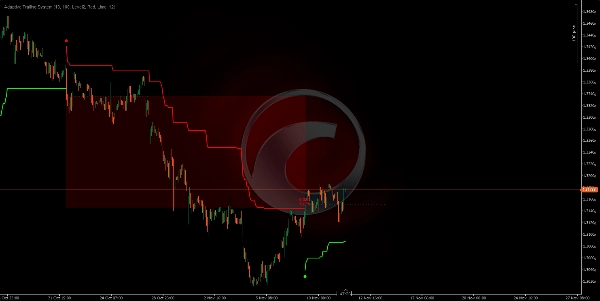
Spotware GBPUSD 691360763c684 | cTrader
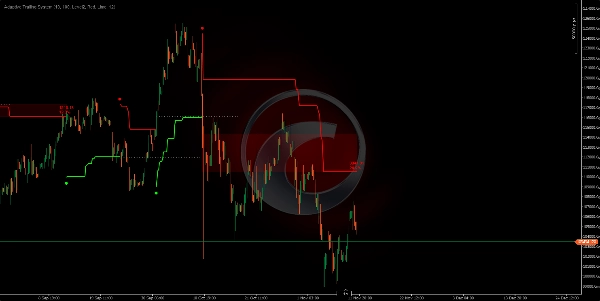
Spotware XAUUSD 691360adf1386 | cTrader
Spotware XAUUSD 691360adf1386 | cTrader
Algoritmo Único de Trailing Adaptativo ⚙️
O sistema utiliza um método estatístico que nunca gera as mesmas distâncias de trailing:
• Calcula o True Range do preço durante um período configurável.
• Aplica uma transformação logarítmica nesses valores para normalizar a distribuição.
• Calcula a média e o desvio padrão desses valores logarítmicos.
• Gera uma distância de offset única baseada nos níveis de volatilidade (0, 1, 2 ou 3 desvios padrão). 🎯
• O trailing stop é continuamente ajustado usando o preço típico (média de High, Low, Close).
Resultado: Cada momento do mercado tem sua própria distância de trailing, calculada conforme a volatilidade específica daquele contexto. 🤖
Fundamento Técnico: Volatilidade Normalizada Logarítmica 🧠
Por que uma transformação logarítmica? 🤔
A volatilidade do mercado não segue uma distribuição normal (Gaussiana); tende a apresentar valores extremos. A transformação logarítmica:
- Normaliza a distribuição: Converte dados enviesados em uma distribuição mais simétrica.
- Estabiliza a variância: Reduz o impacto de picos extremos de volatilidade.
- Permite comparação estatística: Torna possível usar o desvio padrão de forma significativa.
Processo de Cálculo do Offset 🔢
- True Range do Período: Mede a faixa máxima, considerando o High-Low do período e gaps com o fechamento anterior.
- Logaritmo Natural: Aplica
ln(True Range)para normalizar. - Janela de Normalização: Mantém os últimos N valores logarítmicos (período de normalização).
- Média Logarítmica: Média de todos os
ln(TR)valores na janela. - Desvio Padrão: Calcula a dispersão dos valores logarítmicos.
- Nível de Volatilidade: Multiplica o desvio por 0, 1, 2 ou 3 conforme a configuração.
- Offset Final:
Offset = e^(média + nível × desvio)- converte de volta para a escala de preço. 💡
Como Funciona? ⚡
Mecânica de Trailing Bidirecional
O sistema opera em dois modos alternados:
Modo BEARISH (Venda): 📉
• O trailing stop é colocado ACIMA do preço.
• Ele é atualizado para baixo quando o preço cai (nunca sobe).
• Sinal de reversão quando o preço FECHA acima do trailing stop.
Modo BULLISH (Compra): 📈
• O trailing stop é colocado ABAIXO do preço.
• Ele é atualizado para cima quando o preço sobe (nunca cai).
• Sinal de reversão quando o preço FECHA abaixo do trailing stop.
Sinais de Reversão:
• Um ponto circular marca a mudança de tendência (entrada de uma nova posição).
• Cor verde = Nova tendência de alta (). ✅
• Cor vermelha = Nova tendência de baixa (). 🔴
Parâmetros e Impacto 🎛️
Período de Cálculo (10)
- Função: Define quantas barras são usadas para calcular o True Range.
- ↑ Maior (20-50): Mede a volatilidade de longo prazo, mais suave, menos sensível.
- ↓ Menor (5-8): Mede a volatilidade de curto prazo, mais reativo, detecta mudanças rápidas.
Período de Normalização (100)
- Função: Janela de valores logarítmicos para calcular a média e o desvio padrão.
- ↑ Maior (200-500): Normalização mais estável, mudanças graduais no offset.
- ↓ Menor (50-80): Normalização mais reativa, offset se adapta mais rápido.
- Impacto Crítico: Este parâmetro determina o quão "memorizado" o contexto histórico de volatilidade está. 🧠
Nível de Volatilidade (Nível 2)
- Função: Número de desvios padrão aplicados ao cálculo do offset.
- Nível 0 (0σ): Offset = média logarítmica = distância mais apertada, máxima sensibilidade. 🎯
- Nível 1 (1σ): Offset inclui 1 desvio = distância moderada, captura ~68% da variação.
- Nível 2 (2σ): Offset inclui 2 desvios = distância maior, captura ~95% da variação (balanceado). ⚖️
- Nível 3 (3σ): Offset inclui 3 desvios = distância muito ampla, captura ~99% da variação, máxima tolerância. 🛡️
___________________________________________________________________________________________________
🚀 Mais de 10.000 traders já usam nossos PRINCIPAIS indicadores🏆
👉 Obtenha todos os nossos sistemas TOP aqui:
_______________________________________________
📌 Indicadores de Estrutura de Mercado
· ✅ AdvancedMarket Structure: Bos, Choch, SwinLevels, Order Blocks, Market Structure& Liquidity Finder
· 🔄 Dynamic Market StructureAnalysis of Turning Points
· 🧱 Order Block
· ⚖️ Market Imbalance
· ⛓️ BOS & CHOCH
· 🧠 ICT Power of 3
_______________________________________________
🔚 Sistemas Inteligentes de Saída
_______________________________________________
📐 Indicadores ZigZag
· 🔍 ZigZag Price LiquidityProjection
· ➖ ZigZag
_______________________________________________
🧱 Indicadores de Suporte e Resistência
· 🟩 SmartTrend Support &Resistance Lines
· 🧱 All Support and ResistanceLevels
_______________________________________________
📊 Indicadores de Tendência e Canal
· 📊 Supertrend
_______________________________________________
💧 Ferramentas de Volume e Liquidez
_______________________________________________
⚡ Indicadores de Momentum e RSI
· 🔎 Multi-Level Candle Bias
Tracker
_______________________________________________
🔮 Ferramentas de Previsão e Projeção
· 📐 Previsão Baseada em Linreg& ATR
· 📏 Regressão Linear FibonacciMulti-timeframe
· 📈 Projetor de Fluxo de Mercado Alimentado por Volume_________________________________________________________________________________________________
Resumo
The system operates bidirectionally with two modes:
- Bearish (short) mode places the trailing stop above the price, adjusting downward as price falls, signaling a reversal when price closes above the stop.
- Bullish (long) mode places the trailing stop below the price, adjusting upward as price rises, signaling a reversal when price closes below the stop.
Reversal signals are visually marked with colored dots indicating trend changes (green for bullish, red for bearish). Key parameters include the calculation period for True Range, normalization period for volatility data, and volatility level defining the offset distance based on standard deviations.
This indicator supports various markets including Forex, cryptocurrencies, commodities, indices, and stocks, with symbols such as BTCUSD, EURUSD, GBPUSD, XAUUSD, NAS100, and USDJPY. It is designed to provide adaptive trailing stops that respond to real-time volatility, enhancing trade exit strategies.


