
Penerangan
ZON HABA STRUKTURAL
Peta Keamatan Penyertaan
--------------------------------------------------
Lihat di mana harga bertarung. Lihat di mana ia mengabaikan.
Kebanyakan alat sokongan/rintangan melukis garis di mana harga PERNAH berada.
Zon Haba Struktural menjawab: Adakah pasaran benar-benar AMBIL PEDULI tentang tahap ini?
--------------------------------------------------
PENILAIAN KEAMATAN HABA (0 hingga 100)
Penunjuk menganalisis pengelompokan ayunan dan memberikan skor haba:
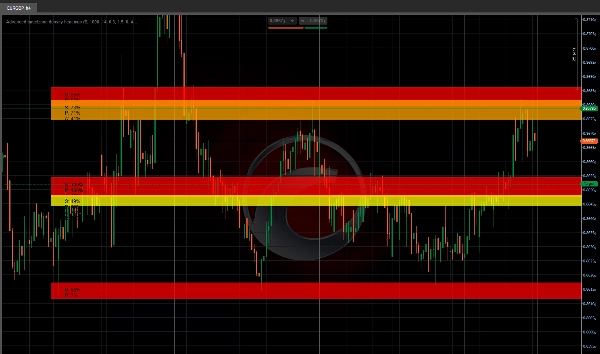
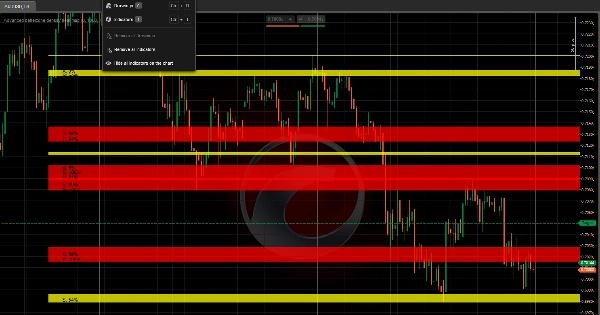
- Zon merah (80 hingga 100 haba) = Penyertaan struktural terkuat
- Zon jingga (60 hingga 80 haba) = Zon struktural aktif
- Zon kuning (40 hingga 60 haba) = Minat sederhana
- Zon biru (di bawah 40 haba) = Struktur lemah
Haba lebih tinggi = lebih banyak ayunan berkumpul = lebih banyak perhatian pasaran.
--------------------------------------------------
PENJEJAKAN PENERIMAAN VS PENOLAKAN
Untuk setiap zon haba struktural, penunjuk menjejaki tingkah laku harga:
- PENERIMAAN = Harga ditutup di dalam zon (tingkah laku sokongan)
- PENOLAKAN = Harga meninggalkan sumbu panjang di zon (tingkah laku rintangan)
Ini memberitahu anda sama ada zon itu mungkin MEMEGANG atau MEMBALIK.
--------------------------------------------------
ANALISIS PENGLIBATAN PASARAN
Sistem mengukur:
- Sentuhan lilin (berapa kerap harga melawat setiap zon)
- Penutupan di dalam (kadar penerimaan)
- Penolakan sumbu (kadar penolakan)
- Tempoh tinjauan yang boleh dikonfigurasikan
Penglibatan rendah = zon lemah. Penglibatan tinggi = zon haba struktural.
--------------------------------------------------
PEMETAAN KEAMATAN VISUAL
- Zon berwarna mengikut skor haba (merah = paling panas)
- Sambungan halo untuk visualisasi penolakan
- Label data menunjukkan: Haba / Penyertaan / Penerimaan / Skor Penolakan
- Pembersihan automatik (zon dilukis semula secara automatik)
- Anak panah ayunan tinggi/rendah pilihan
--------------------------------------------------
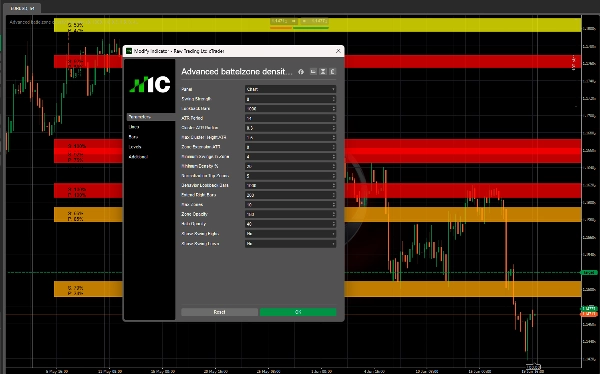
PARAMETER UTAMA
- Kekuatan Ayunan: Kepekaan pivot (lebih tinggi = kurang ayunan)
- Bar Tinjauan: Sejauh mana untuk mengesan ayunan
- Tempoh ATR: Untuk pengiraan jejari adaptif
- Jejari ATR Kluster: Sejauh mana ayunan mesti dekat untuk berkumpul
- Ketinggian Maksimum Kluster ATR: Menolak zon yang lebih lebar daripada ini
- Sambungan Zon ATR: Saiz halo untuk pengesanan penolakan
- Minimum Ayunan Dalam Zon: Saiz kluster minimum
- Skor Haba Minimum: Hanya tunjukkan zon di atas ini
- Bar Tinjauan Tingkah Laku: Tempoh untuk penjejakan penglibatan
- Maksimum Zon: Maksimum zon yang dipaparkan
- Ketelusan Zon / Halo: Ketelusan visual
--------------------------------------------------
KES PENGGUNAAN
- Cari zon haba struktural sebenar (haba tinggi + penglibatan tinggi)
- Bezakan zon penerimaan daripada zon penolakan
- Elakkan kawasan haba rendah, penyertaan rendah
- Kenal pasti kluster struktural untuk penempatan masuk dan keluar
- Kesepaduan dengan penunjuk trend atau aliran pesanan
--------------------------------------------------
NOTA TEKNIKAL
- Penunjuk lapisan (melukis pada carta harga)
- Berfungsi pada mana-mana jangka masa dan simbol
- Auto menyesuaikan dengan volatiliti melalui ATR
- Tiada lukisan semula (ayunan adalah sejarah)
--------------------------------------------------
DARI PEMBUAT INVICTUS EA
Zon Haba Struktural berkongsi teknologi penyertaan struktural yang sama yang terdapat dalam sistem perdagangan automatik Invictus.
--------------------------------------------------
PENDEDAHAN RISIKO
Penunjuk ini adalah alat analitik. Ia tidak menjana isyarat perdagangan automatik. Semua keputusan perdagangan adalah tanggungjawab pengguna.
--------------------------------------------------
SOKONGAN
Kemas kini seumur hidup disertakan.
UNTUK MAKLUMAT LANJUT - Klik Profil Pembangun di bawah.
Ringkasan
Key features include color-coded heat zones, halo extensions for rejection visualization, and data labels displaying heat, participation, acceptance, and rejection scores. The system measures candle touches, closes inside zones, and wick rejections over a configurable lookback period to quantify market engagement. Adjustable parameters allow customization of swing sensitivity, cluster radius, zone size, and visual opacity.
This tool supports any timeframe and symbol, adapts to volatility using ATR, and does not repaint historical swings. It is intended for identifying genuine structural heat zones, differentiating acceptance from rejection areas, and aiding entry and exit placement in conjunction with other trend or order flow indicators. The indicator is analytical and does not generate automated trading signals.
Ulasan pelanggan
5 | 100 % | |
4 | 0 % | |
3 | 0 % | |
2 | 0 % | |
1 | 0 % |


![Logo "[Stellar Strategies] Market Session Ultimate"](https://cdn.ctrader.com/image/webp/61ffd537-0125-4246-9e72-42eca1791d64_28232)


