VIX - volatility indicator - Renko
Indikator
Versi 1.0, Feb 2025
Windows, Mac
Penerangan
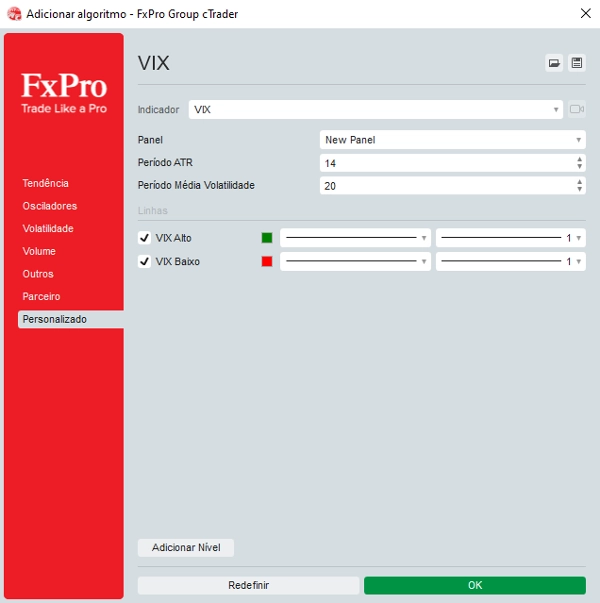
Laraskan parameter: Masukkan nilai yang dikehendaki untuk tahap LowLevel dan HighLevel, dan laraskan Faktor Skala VIX supaya garis VIX berada pada ketinggian yang dikehendaki.
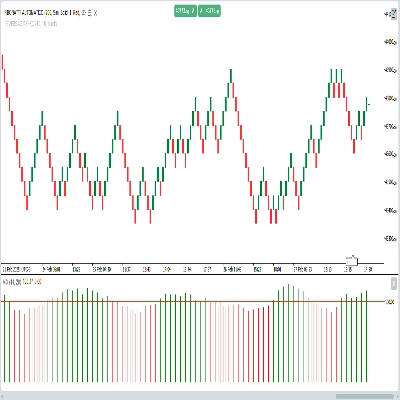
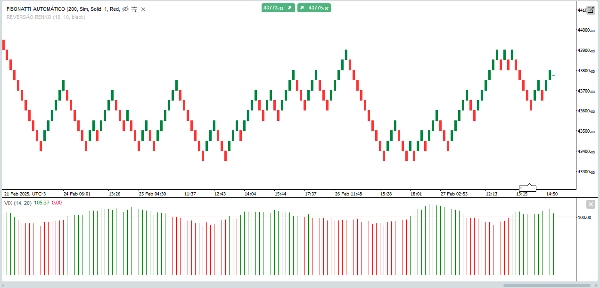
Lihat pada graf:
Apabila VIX melebihi HighLevel dan volum adalah tinggi (lilin hijau), anda boleh menganggap bahawa terdapat pecahan.
Apabila VIX berada di bawah LowLevel, ia mungkin menunjukkan tempoh turun naik yang rendah.
Ringkasan
Profil indikator
Ulasan pelanggan
0.0
Ulasan: 0
Ulasan pelanggan
Belum ada ulasan untuk produk ini. Anda sudah mencuba produk tersebut? Jadilah yang pertama untuk berkongsi pendapat anda!
Perbincangan
Soalan Lazim
Breakout
Produk yang tersedia melalui cTrader Store, termasuk bot dagangan, indikator dan plugin, disediakan oleh pembangun pihak ketiga dan diberikan akses untuk tujuan maklumat dan teknikal sahaja. cTrader Store bukan broker dan tidak memberikan nasihat pelaburan, syor peribadi atau sebarang jaminan prestasi masa hadapan.


Harga
Sejak 05/02/2025
30
Jualan