
Opis
Nasz produkt integruje zestaw kluczowych wskaźników, aby zapewnić Ci kompleksową perspektywę rynku:
- Range Box Fibonacci (nasze własne dzieło): Unikalne narzędzie, które pomaga zidentyfikować potencjalne strefy wsparcia i oporu na podstawie poziomów Fibonacciego.
- Kluczowe ceny odniesienia: Określamy kluczowe punkty cenowe wynikające z konfluencji trzech konfigurowalnych wskaźników (CCI, Stochastic, RSI). Te punkty pomogą Ci w identyfikacji okazji do wejścia i wyjścia z pozycji.
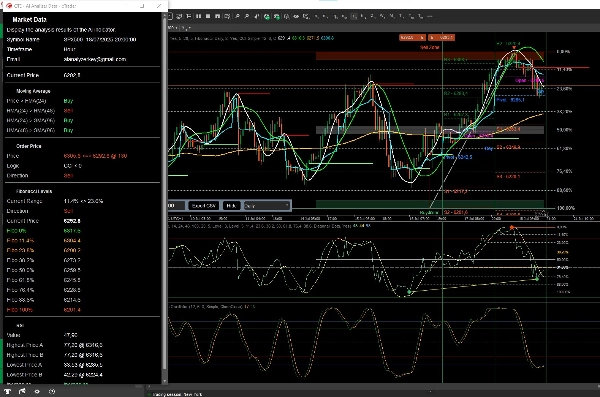
- Trzy konfigurowalne średnie kroczące: Wybierz średnie kroczące najlepiej dopasowane do Twojej strategii, aby potwierdzać trendy i wykrywać zmiany kierunku ceny.
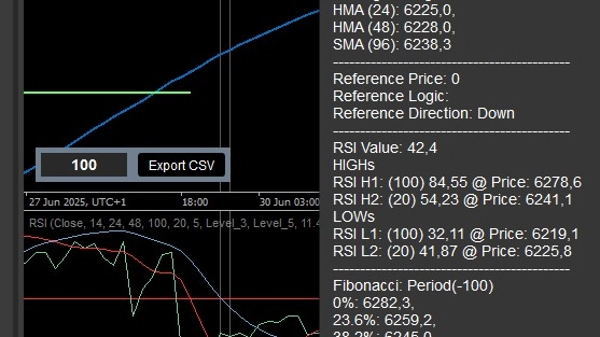
- RSI: Dla dokładniejszych prognoz ruchów cen. Z wartościami wysokimi i niskimi dla wybranych okresów. Nie jest uwzględniony w wizualizacji.
AI Quantum Trading Edge zbiera i przetwarza dane z tych wskaźników, oferując dwa sposoby wizualizacji:
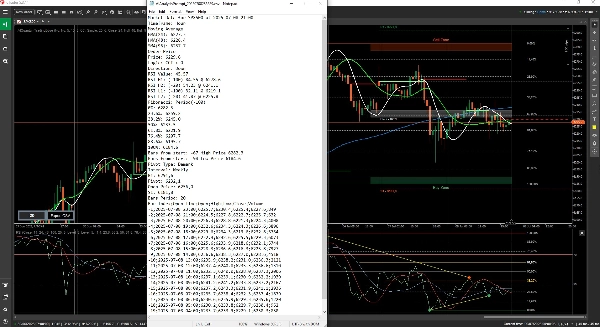
- Tryb ręczny: Jasne i zwięzłe okno podsumowujące, czy cena według każdej konfiguracji wskaźnika zmierza w górę czy w dół.
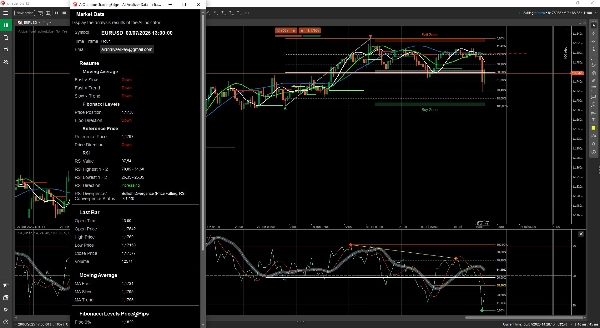
- Wtyczka cTrader: Bezproblemowa integracja bezpośrednio z platformą cTrader, wyświetlająca te same informacje w sposób wizualny i przystępny.
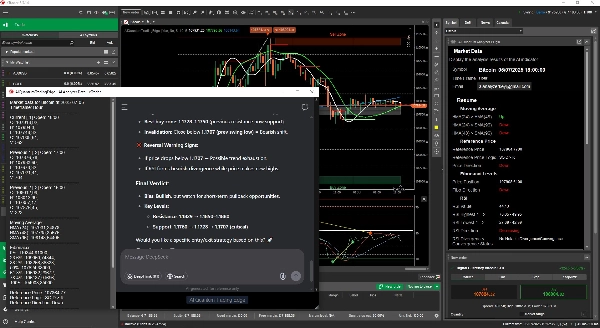
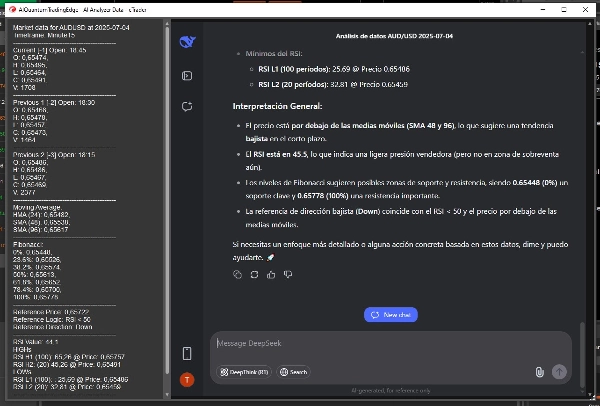
Co więcej, rozumiemy znaczenie komunikacji człowiek-maszyna we współczesnym świecie handlu. Dlatego AI Quantum Trading Edge generuje tekstowy prompt ze wszystkimi analizowanymi danymi. Ten prompt jest zaprojektowany tak, aby był zrozumiały zarówno dla ludzkich traderów, jak i agentów AI, tworząc wspólny język analizy rynku. Wreszcie, agent AI może bezpośrednio analizować te dane, aby dostarczyć Ci dodatkowych spostrzeżeń.
Dzięki AI Quantum Trading Edge otrzymasz informacje potrzebne do podejmowania bardziej świadomych i strategicznych decyzji handlowych.
Aktualizacja:
Możliwość eksportu do Excela (CSV)
Poprawa wydajności
Dodano Pivot Point: dzienny, tygodniowy, miesięczny
Aby znaleźć wyeksportowany plik, przejdź do C:\Users\{User}\Documents\cAlgo\Data\Indicators\AIQuantumTradingEdge-V3
Wiele ulepszeń, w tym kolorowe promptsy i wydajność
Ten wskaźnik składa się z
RangeBoxFibonacci: https://ctrader.com/products/526
OrderPrice: https://ctrader.com/products/397
TSPivot: https://ctrader.com/products/544
oraz niewidoczna część FiboTrendPro: https://ctrader.com/products/653


![Logo „Wyckoff Toolkit [Iridio Capital]”](https://cdn.ctrader.com/image/webp/8acfe6a1-6a8e-4578-9367-9df3af2b1801_27763)


