
설명
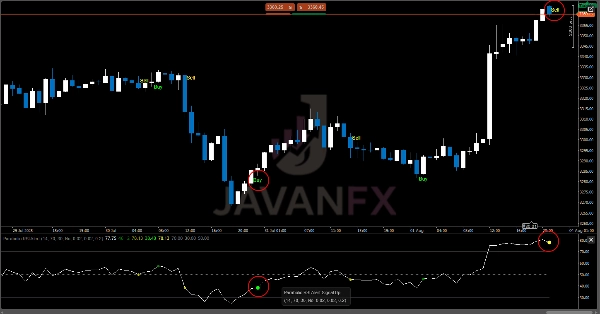
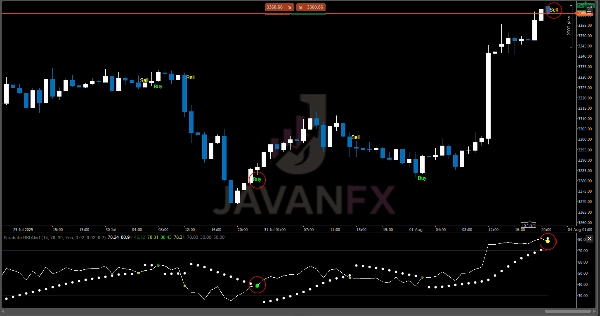
파라볼릭 RSI 알림은 상대 강도 지수(RSI)의 정밀성과 맞춤형 파라볼릭 SAR의 동적 추세 추종 기능을 결합한 강력한 지표입니다. 이 독특한 결합은 트레이더가 높은 확률의 반전 지점을 명확한 시각적 신호와 실시간 알림으로 식별하는 데 도움을 줍니다.
사용 참고사항:
- 이 지표는 1시간 이상 타임프레임에서 가장 잘 작동합니다
- 과매수/과매도 구역에서 반전이 발생할 때 강한 신호가 나타납니다
- 극단적인 구역 외부에서 반전이 발생할 때 일반 신호가 나타납니다
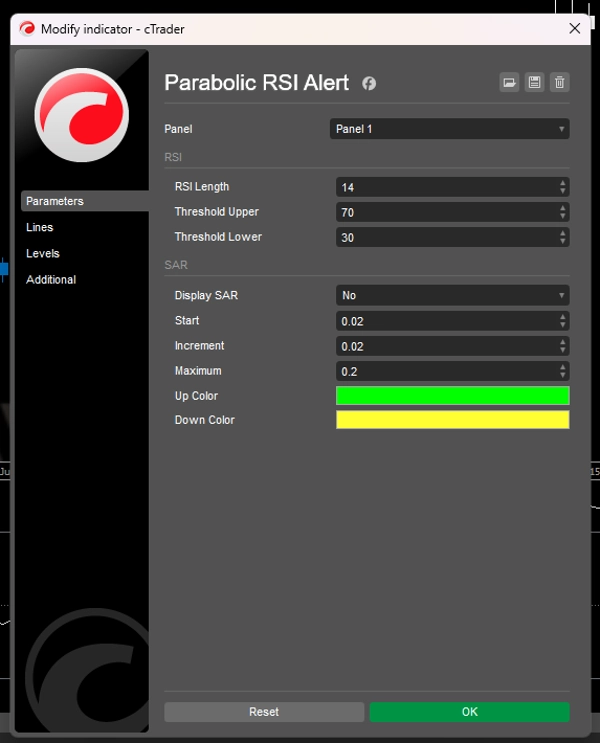
- SAR 포인트는
Display SAR가 활성화된 경우에만 표시됩니다 - 진입 및 청산 포인트를 확인하기 위해 가격 행동 및 다른 지표와 결합하여 사용하세요(선택 사항).
다음과 같은 트레이더에게 이상적입니다:
- 전통적인 RSI 분석에서 지연을 줄이고자 하는 분
- 시기적절한 진입을 위한 명확한 시각 및 청각 알림이 필요한 분
- 주관적인 차트 해석보다 기계적인 신호를 선호하는 분
요약
지표 프로필
고객 리뷰
0.0
리뷰: 0
고객 리뷰
이 상품에 대한 리뷰가 아직 없습니다. 이미 사용해 보셨나요? 다른 사람들에게 가장 먼저 소개해 주세요!
상담
자주 묻는 질문(FAQ)
트레이딩 봇, 지표, 플러그인 등 cTrader Store에서 제공되는 상품은 제3자 개발자에 의해 제공되며, 이는 단순히 정보 및 기술적 접근을 목적으로 제공된 것입니다. cTrader Store는 중개인이 아니며, 투자 조언, 개인별 추천 또는 향후 성과에 대한 어떠한 보장도 제공하지 않습니다.


좋아하실 만한 다른 항목


가격
가입일 14/07/2025
60
판매