
Opis
Ten wskaźnik identyfikuje strefy płynności i bloki zleceń na rynku, opierając się na koncepcjach z teorii Smart Money Market (ICT/SMC).
https://ctrader.com/pt/products/1560
https://ctrader.com/pt/products/1386
Wskaźnik działa w czterech głównych krokach:
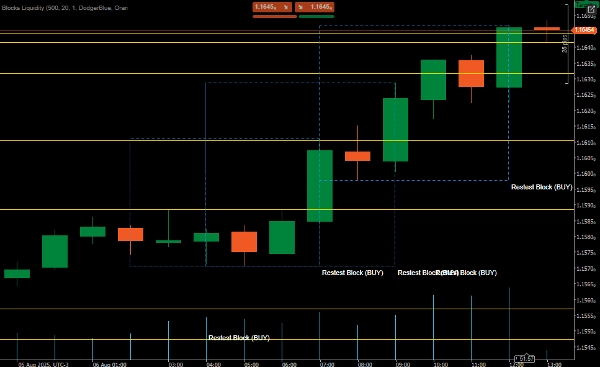
✅Identyfikacja Bloków Zleceń
Wykrywa ruchy impulsowe (domyślnie minimum 20 pipsów)
Znajduje strefy konsolidacji przed impulsem
Klasyfikuje jako blok kupna lub sprzedaży
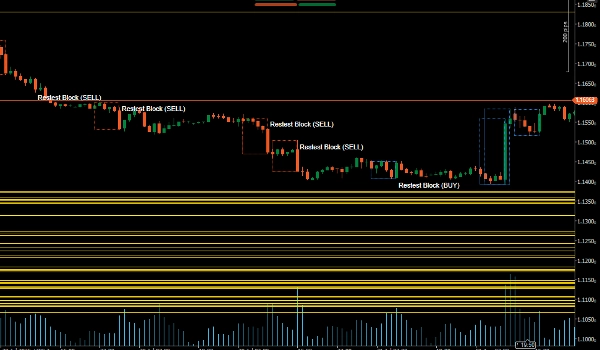
✅Identyfikacja Puli Płynności
Oznacza ostatnie maksima i minima jako strefy płynności
Te obszary reprezentują potencjalne cele lub punkty zatrzymania
✅Potwierdzenie Retestu
Sprawdza, kiedy cena wraca do bloków zleceń
Potwierdza za pomocą formacji odwrócenia (Pin Bar/Engulfing) i wolumenu
✅Wizualizacja na wykresie
Rysuje bloki zleceń i strefy płynności
Wydaje dźwiękowe alerty po potwierdzeniu
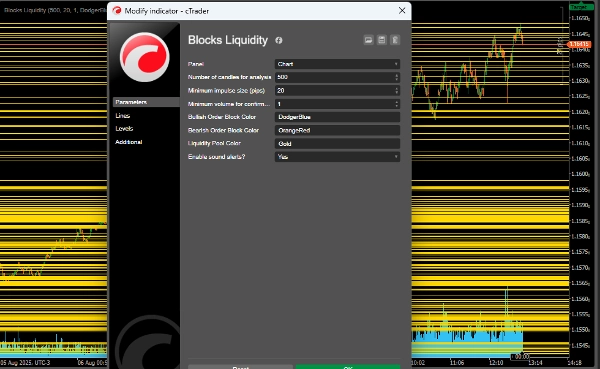
✅Konfigurowalne parametry
LookbackPeriod: liczba świec do analizy (domyślnie 500)
MinImpulsePips: minimalny rozmiar ruchu impulsowego (20 pipsów)
MinVolumeThreshold: minimalny wolumen do potwierdzenia (1.0)
Możliwość dostosowania kolorów dla byczych/niszczących bloków i stref płynności
Opcja dźwiękowego alertu
✅Logika handlu
Bycze (kupno) bloki:
Tworzone po konsolidacji i wzrostowym impusie
Potencjalna strefa wsparcia
Wejście potwierdzone formacją odwrócenia + wolumenem przy retescie
Niedźwiedzie (sprzedaż) bloki:
Tworzone po konsolidacji i spadkowym impusie
Potencjalna strefa oporu
Wejście potwierdzone w ten sam sposób
✅Pule płynności:
Ostatnie maksima/minima jako cele lub punkty zatrzymania
Obszary, gdzie prawdopodobnie koncentrują się zlecenia stop
Podsumowanie
Key features include:
- Order Block Identification: Detects bullish and bearish blocks formed after consolidation and momentum shifts, serving as potential support or resistance zones.
- Liquidity Pool Identification: Highlights recent highs and lows that may act as targets or stop areas due to stop order concentration.
- Retest Confirmation: Validates entries by checking price returns to order blocks combined with reversal candlestick patterns (Pin Bar, Engulfing) and volume thresholds.
- Chart Visualization: Draws order blocks and liquidity zones with customizable colors and provides sound alerts upon confirmation.
- Configurable parameters such as lookback period, minimum impulse size, and volume threshold allow adaptation to different trading preferences.
This indicator supports analysis of price action dynamics to assist traders in identifying key market levels and potential trade entry points.
Opinie klientów
5 | 100 % | |
4 | 0 % | |
3 | 0 % | |
2 | 0 % | |
1 | 0 % |


