Opis
Wskaźnik MagicLiquidity to zaawansowane narzędzie, które identyfikuje strefy płynności, bloki zleceń oraz poziomy stop-loss na rynku, pomagając traderom w identyfikacji kluczowych obszarów wsparcia/oporu oraz potencjalnych punktów zwrotnych.
Główne pojęcia
Bloki zleceń: Obszary, gdzie duzi uczestnicy rynku mogli złożyć znaczące zlecenia
Pule płynności: Poziomy, na których występuje koncentracja zleceń stop lub oczekujących
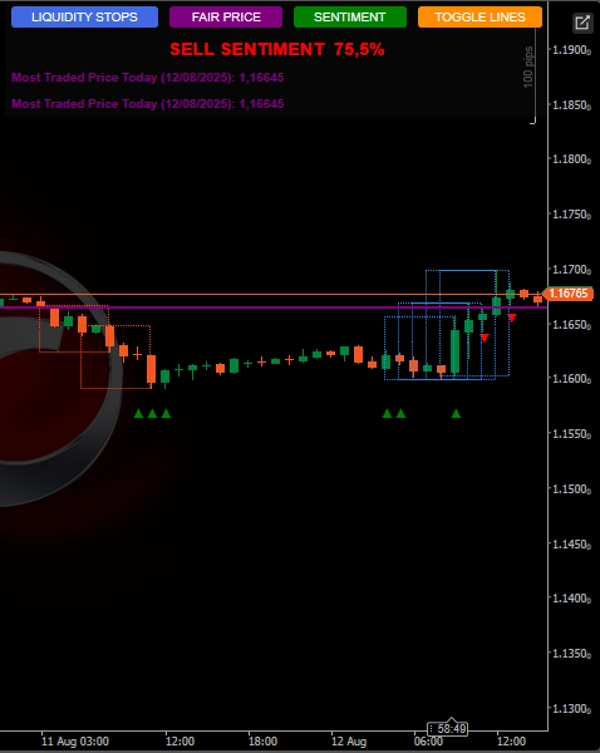
Najczęściej handlowana cena (Fair Price): Poziom cenowy z najwyższym wolumenem obrotu dnia
Jak działa wskaźnik
Identyfikacja bloków zleceń
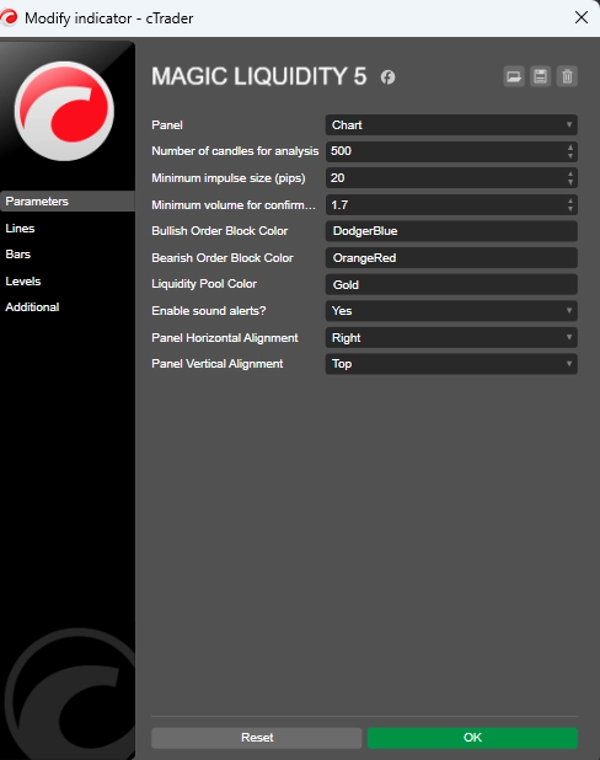
Wykrywa impulsywne ruchy o konfigurowalnym minimalnym rozmiarze w pipsach
Identyfikuje konsolidacje po tych ruchach
Klasyfikuje jako blok byczy lub niedźwiedzi w zależności od kierunku impulsu
Wykrywanie puli płynności
Identyfikuje maksima i minima w analizowanym okresie
Śledzi poziomy powyżej i poniżej bieżącej ceny
Liczy, ile puli płynności zostało zlikwidowanych
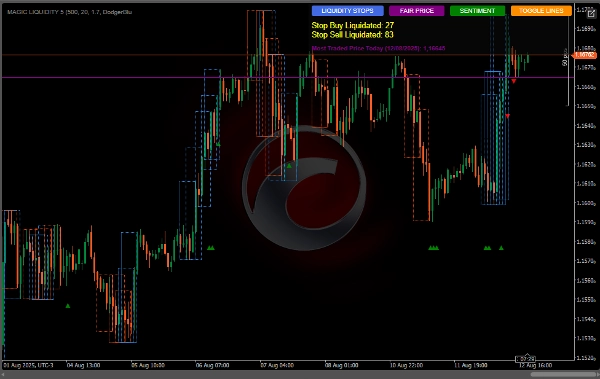
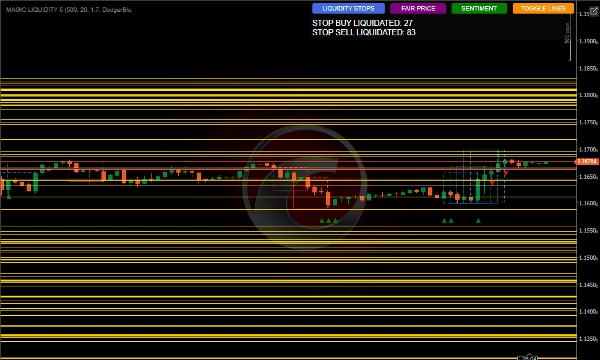
Panel informacyjny
Pokazuje liczbę zlikwidowanych zleceń stop buy/sell
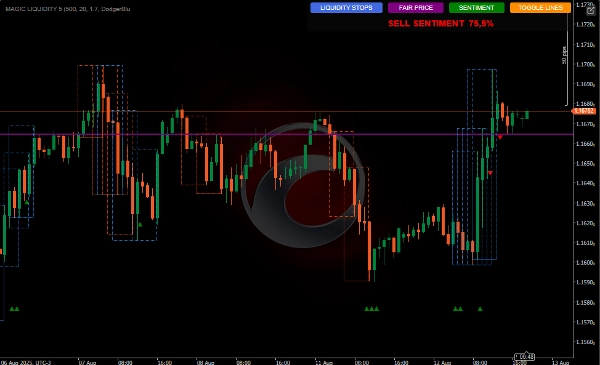
Wyświetla sentyment rynku byczy/niedźwiedzi
Pokazuje najczęściej handlowaną cenę dnia
Pozwala włączyć/wyłączyć wyświetlanie linii
Potwierdzenie wolumenu
Wzór odwrócenia
Stop loss powyżej bloku
Płynność handlowa
Likwidacja Buy Stop: Gdy cena osiąga pulę płynności powyżej:
Może wskazywać na wyczerpanie kupujących - przygotuj się do sprzedaży
Wejście po potwierdzeniu odwrócenia
Likwidacja Sell Stop: Gdy cena osiąga pulę płynności poniżej:
Może wskazywać na wyczerpanie sprzedających - przygotuj się do kupna
Wejście po potwierdzeniu odwrócenia
Wykorzystanie sentymentu
Gdy więcej puli płynności zostaje zlikwidowanych powyżej: nastawienie na sprzedaż
Gdy więcej puli płynności zostaje zlikwidowanych poniżej: nastawienie na kupno
Używaj jako filtru do dopasowania transakcji do dominującego sentymentu
Najczęściej handlowana cena (Fair Price)
Może służyć jako poziom breakeven
Transakcje powyżej: nastawienie bycze
Transakcje poniżej: nastawienie niedźwiedzie
Może być używany jako cel lub punkt odwrócenia
.


![Logo „High-Low Divergence [Iridio Capital]”](https://cdn.ctrader.com/image/webp/443c4661-7abb-40f1-842f-4b6ec560649b_40914)


