
Opis
Ultimate RSI (Wskaźnik Siły Względnej)
The Ultimate RSI to zaawansowany i dostosowany oscylator zaprojektowany, aby dostarczać płynniejsze, czystsze i bardziej responsywne odczyty impulsu rynku oraz siły trendu. Stanowi znaczącą poprawę w stosunku do tradycyjnego Wskaźnika Siły Względnej (RSI), koncentrując się na filtrowaniu szumów rynkowych i minimalizowaniu fałszywych sygnałów (whipsaws). Czyni to z niego nieocenione narzędzie do potwierdzania trendów i precyzyjnego wskazywania wiarygodnych punktów zwrotnych.
Kluczowe cechy i ulepszenia:
- Rozszerzone obliczanie impetu: Wskaźnik wykorzystuje zaawansowaną metodę obliczania zmiany ceny. Zamiast polegać wyłącznie na dziennych ruchach cen, sygnał impetu jest znacznie wzmacniany, gdy cena osiąga nowy szczyt lub nowy dołek w okresie analizy. Proces ten zapewnia, że wskaźnik reaguje silnie na prawdziwe wybicia, ignorując drobne, niestabilne ruchy.
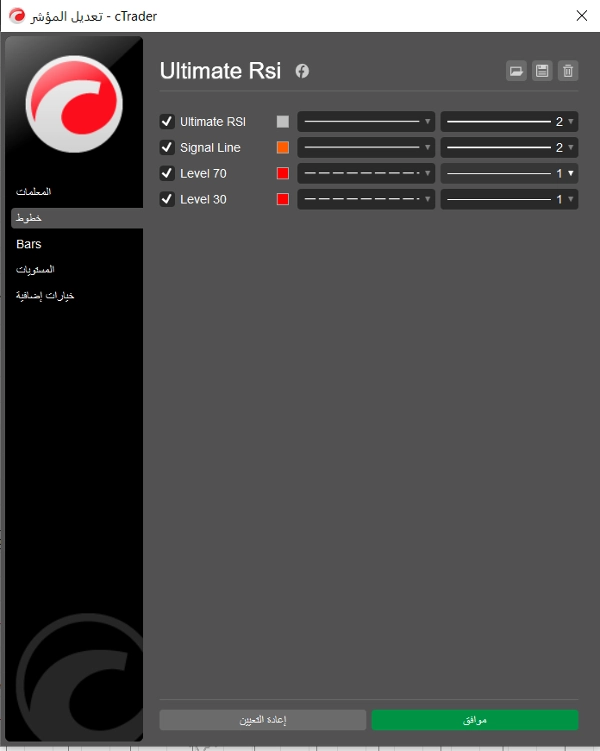
- Dedykowana linia sygnału: Zawiera wyraźną Linię Sygnału (średnia krocząca samego RSI), którą można konfigurować niezależnie. Przecięcia między linią Ultimate RSI a jej Linią Sygnału są często używane jako wyraźniejsze, bardziej wiarygodne sygnały do wejścia lub wyjścia, szczególnie w pobliżu poziomów wykupienia/wyprzedania.
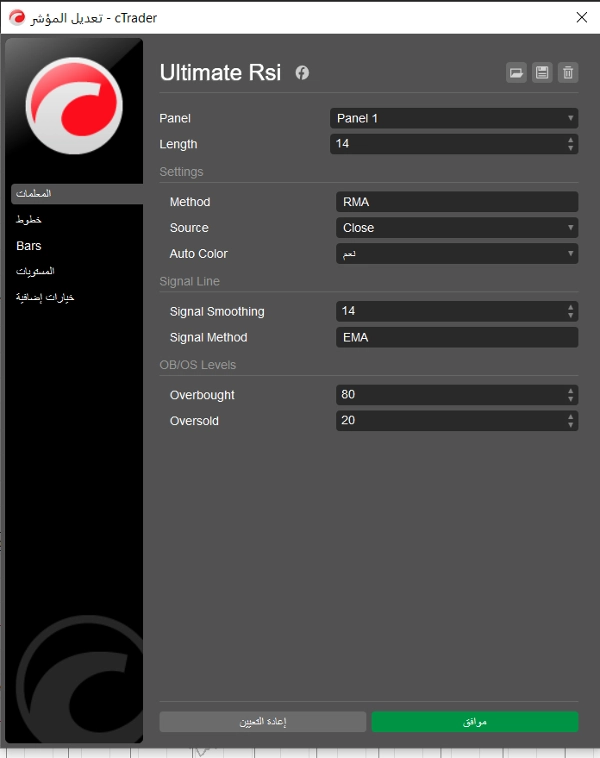
- Elastyczne metody wygładzania: Użytkownicy mają możliwość wyboru typu wygładzania zarówno dla obliczeń RSI, jak i Linii Sygnału spośród popularnych opcji: EMA (Wykładnicza Średnia Krocząca), SMA (Prosta Średnia Krocząca), RMA (Średnia Krocząca Wildera) oraz TMA (Trójkątna Średnia Krocząca). Pozwala to na precyzyjne dostosowanie czułości wskaźnika.
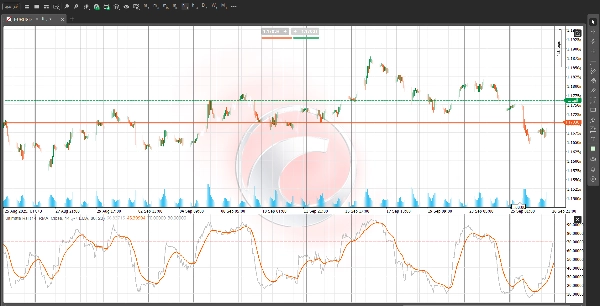
- Wizualne strefy OB/OS: Domyślny poziom wykupienia (OB) na 80 oraz poziom wyprzedania (OS) na 20 są wyraźnie oznaczone tłem. Na rynkach o silnych trendach, utrzymujące się odczyty w tych strefach często wskazują na wyjątkową siłę trendu, a nie na natychmiastową korektę, oferując potężne narzędzie potwierdzające strategie podążania za trendem.
Jak handlować z Ultimate RSI:
- Potwierdzenie trendu: Używaj poziomu 50 jako centrum impetu. Odczyt stale powyżej 50 potwierdza nastawienie bycze, natomiast odczyt poniżej 50 potwierdza nastawienie niedźwiedzie.
- Sygnały wejścia: Szukaj, aby linia Ultimate RSI przecięła powyżej Linię Sygnału dla potencjalnego wejścia w pozycję długą oraz przecięcia poniżej Linii Sygnału dla potencjalnego wejścia w pozycję krótką, zwracając szczególną uwagę na miejsce tych przecięć względem poziomu 50.
- Redukcja szumów: Poprzez podkreślanie prawdziwej ekspansji zakresu i wykorzystanie zaawansowanego wygładzania, Ultimate RSI pomaga traderom zachować koncentrację podczas okresów konsolidacji, zapobiegając przedwczesnym wejściom lub wyjściom.
Zastrzeżenie: Ten opis ma charakter wyłącznie informacyjny i edukacyjny. Handel wiąże się z ryzykiem, a wszystkie odczyty wskaźników powinny być łączone z kompleksową analizą ruchu cen dla podejmowania decyzji handlowych.


