
Beschreibung
Pressure Scanner 🔍📊
1. Was der Pressure Scanner macht
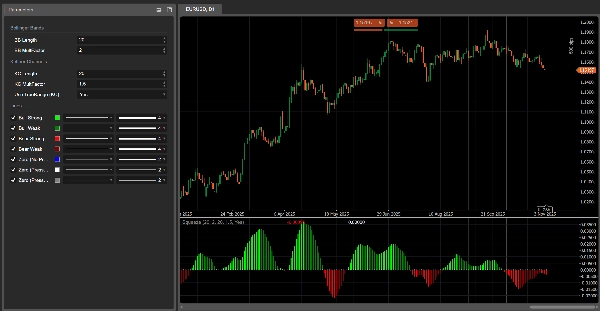
Pressure Scanner ist ein Volatilitäts- und Richtungswerkzeug, das:
- erkennt, wann der Markt unter Volatilitätsdruck / Kompression steht ✅
- zeigt, wann dieser Druck in Expansion freigesetzt wird 💥
- misst die Richtung und Stärke der resultierenden Preisbewegung durch einen Scanner-Wert, der als Histogramm dargestellt wird.
Es kombiniert:
- ein Bollinger-artiges Preisbändchen,
- einen Keltner-artigen Volatilitätskanal,
- und eine linear-regressionsbasierte Scanner-Linie,
um sowohl Druckzustände (an / freigesetzt / neutral) als auch den gerichteten Impuls (aufwärts oder abwärts) anzuzeigen.
2. Wie es funktioniert (Logik)
- Quelle
Der Indikator verwendet den Schlusskurs als Haupteingabe. - Äußeres Volatilitätsband (BB-Stil)
-
- Basis = SMA(close,
BB Length) - Abweichung =
KC MultFactor× Standardabweichung des Schlusskurses - Oberes Band = Basis + Abweichung
- Unteres Band = Basis − Abweichung
- Basis = SMA(close,
- Innerer Volatilitätskanal (KC-Stil)
-
- Mitte = SMA(close,
KC Length) - Spanne = entweder True Range oder Hoch−Tief (eingestellt durch
Use TrueRange) - Durchschnitt der Spanne = SMA(range,
KC Length) - Oberer Kanal = Mitte + rangeAvg ×
KC MultFactor - Unterer Kanal = Mitte − rangeAvg ×
KC MultFactor
- Mitte = SMA(close,
- Druckzustände
Durch den Vergleich des äußeren Bands und des inneren Kanals: -
- Druck AN – schwarze Punkte bei Null
-
- Unteres Band > unterer Kanal und oberes Band < oberer Kanal
- Das Band liegt vollständig innerhalb des Kanals → Volatilität ist komprimiert, hoher Druck.
- Druck FREIGEGEBEN – graue Punkte bei Null
-
- Unteres Band < unterer Kanal und oberes Band > oberer Kanal
- Das Band liegt vollständig außerhalb des Kanals → Volatilität dehnt sich aus nach Druck.
- Neutraler Druck – blaue Punkte bei Null
-
- Jede andere Konfiguration.
- Scanner-Wert (
val)
Das Histogramm zeigt einen Scanner-Wert, der mittels linearer Regression berechnet wird: -
- Über die letzten
KC LengthBalken findet der Indikator: -
- höchstes Hoch,
- tiefstes Tief,
- SMA des Schlusskurses.
- Er baut eine dynamische Mittellinie auf:
-
- rangeMid = (höchstes + tiefstes) / 2
- combinedMid = Durchschnitt(rangeMid, SMA(close))
- Dann definiert er:
scannerInput=close−combinedMid\text{scannerInput} = \text{close} - \text{combinedMid}scannerInput=close−combinedMid - Eine lineare Regression über
KC LengthBalken wird auf diesenscannerInputangewendet, und der Endwert beim letzten Balken ist der Scanner-Wertval.
- Über die letzten
Interpretation:
val > 0→ Preis drückt über die Mittellinie → bullischer Druckval < 0→ Preis drückt unter die Mittellinie → bärischer Druck- Veränderungen in
valBalken-für-Balken → Zunahme oder Abnahme dieses gerichteten Drucks.
3. Wie man die Farben liest
Histogramm – gerichteter Druck (Scanner-Wert)
Jeder Balken des Histogramms entspricht val und ist wie folgt eingefärbt:
- Limette –
val > 0und steigend (val > vorheriger val)
→ starker bullischer Druck, Scanner-Wert verstärkt sich nach oben. - Grün –
val > 0aber fallend (val ≤ vorheriger val)
→ immer noch bullisch, aber Druck lässt nach. - Rot –
val < 0und weiter fallend (val < vorheriger val)
→ starker bärischer Druck, abwärts gerichteter Impuls verstärkt sich. - Dunkelrot –
val < 0aber steigend (val ≥ vorheriger val)
→ immer noch bärisch, aber Druck verliert an Stärke.
Also:
- Über 0 → bullisches Druckregime
- Unter 0 → bärisches Druckregime
- Farbwechsel auf derselben Seite von 0 = Druck beschleunigt vs verlangsamt.
Nulllinie – Druckzustände
Punkte, die bei Null dargestellt werden, zeigen den Druckzustand an:
- Blau – neutraler Druck (normale Volatilität)
- Schwarz – Druck AN (aktive Kompression)
- Grau – Druck FREIGEGEBEN (Expansion nach Kompression)
4. Parameterreferenz (Englisch)
BB Length
Periode für die SMA und Standardabweichung, die im äußeren Volatilitätsband verwendet werden.
- Kürzer → reaktiveres Band, häufigere Druckwechsel.
- Länger → glatteres Band, weniger aber „makro“ Signale.
BB MultFactor
Multiplikator für die Abweichung des äußeren Bands (wird als Benutzerparameter für Flexibilität beibehalten).
In diesem Port ist das Abweichungsverhalten an KC MultFactor gebunden wie in der Originalformel, aber Sie können es anpassen, wenn Sie einen anderen Bandstil wünschen.
KC Length
Periode für:
- die Mittellinie des Volatilitätskanals,
- die Glättung der Spanne,
- das Hoch/Tief-Fenster und die Scanner-Regression.
Definiert, wie weit zurück der Pressure Scanner schaut, um Volatilitätsstruktur und gerichteten Druck zu schätzen.
KC MultFactor
Steuert die Breite des Volatilitätskanals und des äußeren Bands.
- Größerer Wert → breiterer Kanal, weniger Druck-AN-Zustände.
- Kleinerer Wert → engerer Kanal, häufigere Drucksignale.
Use TrueRange (KC)
- true → Kanalspanne verwendet True Range (erfasst Gaps und starke Bewegungen).
- false → Spanne ist einfach Hoch − Tief.
Zusammenfassung
Kundenbewertungen
5 | 0 % | |
4 | 100 % | |
3 | 0 % | |
2 | 0 % | |
1 | 0 % |


![„[Stellar Strategies] MARSI Signal Plotter“-Logo](https://cdn.ctrader.com/image/webp/7b2b8da6-8f8e-4646-8d4a-4710c516c01e_25567)


