Opis
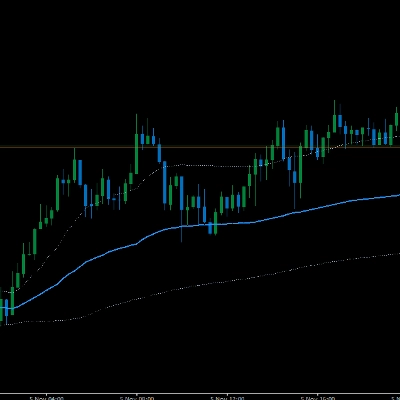
Profesjonalny VWAP, który zawsze oblicza na danych M1—niezależnie od wykresu, na którym jesteś—rysując kotwice dzienne, tygodniowe i miesięczne jednocześnie z opcjonalnymi pasmami oraz w pełni edytowalnymi kolorami i grubością.
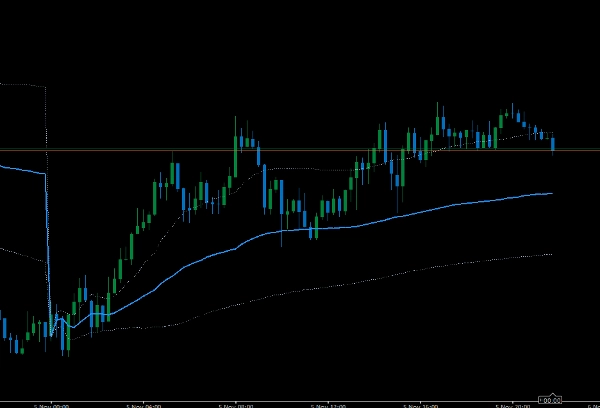
Kompatybilny z wykresami Renko i Heikin Ashi
Multi-Anchored VWAP (silnik M1)
Precyzyjny VWAP stworzony dla traderów, którzy wymagają dokładnego kotwiczenia i przejrzystych wizualizacji. Wskaźnik wewnętrznie wykorzystuje świece 1-minutowe do swoich obliczeń, dzięki czemu możesz przeglądać lub handlować na dowolnym interwale czasowym lub typie wykresu (czas, tick, zakres, Renko, Heikin-Ashi)—twoje VWAP pozostają spójne.
Kluczowe cechy
- Prawdziwy silnik VWAP M1: obliczenia oparte na danych 1-minutowych dla spójnych wyników na wszystkich wykresach.
- 3 kotwice jednocześnie: Dzienna, Tygodniowa, Miesięczna—idealne dla poziomów instytucjonalnych i konfluencji wieloramkowej.
- Pasma włącz/wyłącz dla każdej kotwicy: przełączaj pasma i ustaw mnożnik dla każdego interwału (0 = ukryj).
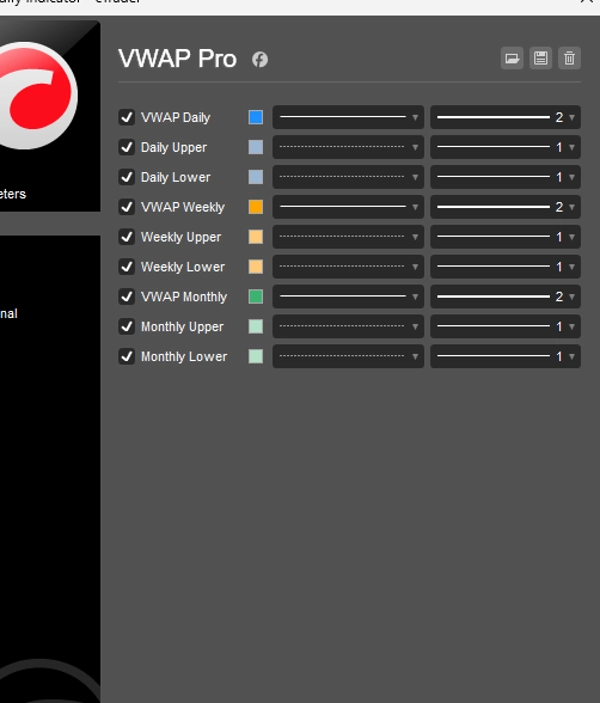
- Stylizuj swoje linie: edytuj kolor i grubość dla każdego VWAP bezpośrednio w ustawieniach wskaźnika.
- Inteligentne resetowanie: automatyczne granice dnia/tygodnia/miesiąca (ISO/tydzień od poniedziałku), bez konieczności ręcznej ingerencji.
- Lekki: zoptymalizowane obliczenia skumulowane; minimalne obciążenie CPU.
Dlaczego Ci się spodoba
- Handluj na dowolnym wykresie/interwale bez dryfu VWAP.
- Zobacz obszary wartości na wyższych interwałach na pierwszy rzut oka.
- Czysty, konfigurowalny wygląd, który pasuje do Twojego szablonu.
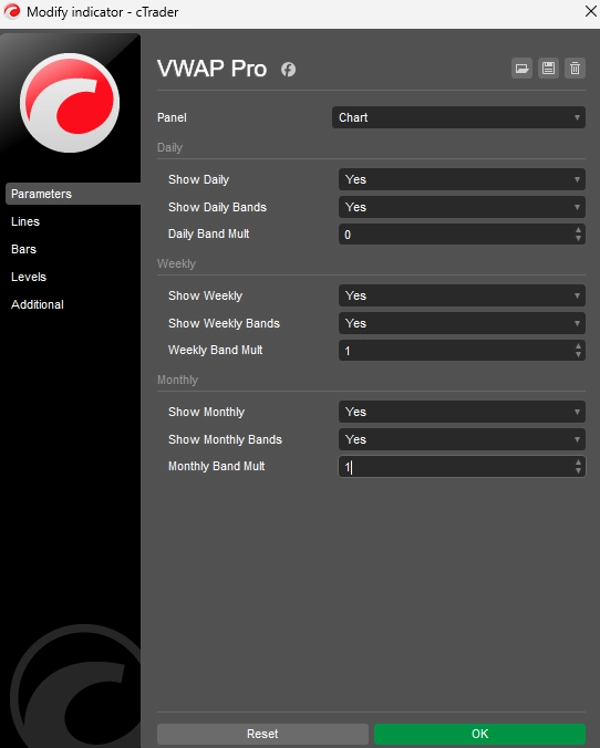
Ustawienia (szybkie)
- Widoczność: Pokaż dzienne / tygodniowe / miesięczne
- Pasma: Pokaż pasma dzienne/tygodniowe/miesięczne, mnożnik pasma dla każdej kotwicy
- Stylizacja: dla każdej kotwicy kolor i grubość (poprzez style wyjściowe)
Uwagi
- Wymaga od brokera historii M1; pierwsze świece mogą pokazywać
NaNaż do załadowania wystarczającej ilości danych M1. - Używa ważenia TickVolume (uniwersalnie dostępne w symbolach cTrader).
Najlepsze dla
Skalperów, traderów intraday i swingowych, którzy dopasowują wejścia do sesyjnego/dziennego/tygodniowego/miesięcznego VWAP oraz pasm odchylenia standardowego.
To nie jest porada finansowa, to niestandardowy wskaźnik, którego używam i uważam, że może być przydatny dla kogoś innego.
Twoje wyniki są Twoją odpowiedzialnością.
Podsumowanie
Opinie klientów
5 | 0 % | |
4 | 100 % | |
3 | 0 % | |
2 | 0 % | |
1 | 0 % |


![Logo „[Stellar Strategies] Market Session Ultimate”](https://cdn.ctrader.com/image/webp/61ffd537-0125-4246-9e72-42eca1791d64_28232)


