Opis
🚀 ICT Breakers (BOS/MSS) - Mistrzowskie zmiany struktury rynku
Odkryj profesjonalne wskazówki handlowe z ICT Breakers, najlepszym narzędziem do identyfikacji kluczowych zmian struktury rynku. Opierając się na metodologii Institutional Composite Trader (ICT), ten wskaźnik automatycznie wykrywa wzorce Break of Structure (BOS) i Market Structure Shift (MSS), które profesjonaliści wykorzystują do identyfikacji kontynuacji i odwróceń trendu.
🔥 Kluczowe funkcje
🎯 Inteligentne wykrywanie sygnałów
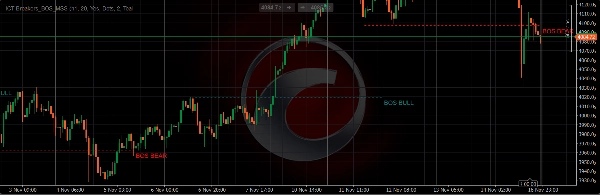
- Break of Structure (BOS): Identyfikuje sygnały kontynuacji trendu
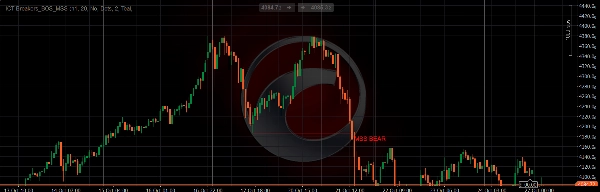
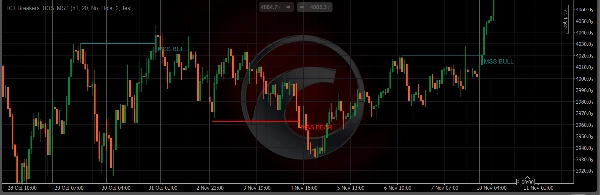
- Market Structure Shift (MSS): Wykrywa potencjalne punkty odwrócenia trendu
- Analiza wielookresowa: Struktura wyższego interwału na wykresach niższego interwału
- Dostosowywana czułość: Reguluj parametry słupków swing dla optymalnego wykrywania
🎨 Profesjonalna wizualizacja
- Sygnały kodowane kolorami: Różne kolory dla byczych/niedźwiedzich BOS i MSS
- Dostosowywane style: Wybierz spośród linii ciągłych, kropkowanych lub kreskowanych
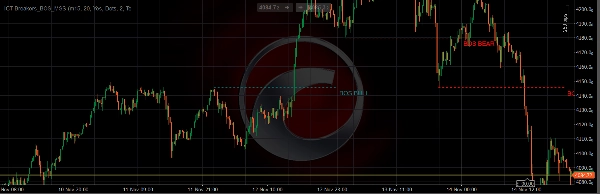
- Wyraźne etykiety: Każdy sygnał oznaczony jako "BOS BULL", "BOS BEAR", "MSS BULL" lub "MSS BEAR"
- Wiele opcji wyświetlania: Pokazuj/ukrywaj BOS lub MSS niezależnie
⚡ Zaawansowana konfiguracja
- Wykrywanie korpusu/knotu: Wybierz kryteria przełamania tylko korpusu lub korpusu + knota
- Regulowane interwały czasowe: Analizuj strukturę z dowolnego wyższego interwału
- Elastyczne ustawienia swingów: Dostosuj czułość punktów zwrotnych
- Personalizacja wizualna: Pełna kontrola nad kolorami, stylami linii i szerokościami
🔔 Inteligentny system alertów
- Alerty wizualne: Powiadomienia tekstowe na wykresie
- Alerty dźwiękowe: Opcjonalne powiadomienia dźwiękowe
- Brak przemalowywania: Sygnały pozostają spójne po utworzeniu
- Niestandardowe nazwy alertów: Personalizuj wiadomości alertów
📈 Jak to działa
ICT Breakers analizuje ruch cenowy, aby zidentyfikować momenty, gdy struktura rynku ulega przełamaniu:
- BOS (Break of Structure): Występuje, gdy cena przełamuje poprzednią strukturę w kierunku trendu, wskazując kontynuację
- MSS (Market Structure Shift): Ma miejsce, gdy cena przełamuje strukturę przeciwnie do trendu, sygnalizując potencjalne odwrócenie
Wskaźnik wykorzystuje zaawansowane wykrywanie punktów zwrotnych na wielu interwałach czasowych, aby dostarczać dokładne, terminowe sygnały, które pomagają Ci:
- Wcześnie wychwycić kontynuacje trendów
- Dostrzec potencjalne odwrócenia zanim się wydarzą
- Handlować z świadomością struktury rynku na poziomie instytucjonalnym
- Zmniejszyć fałszywe sygnały dzięki potwierdzeniu na wielu interwałach
🎯 Idealne dla
- Traderów price action poszukujących instytucjonalnych koncepcji
- Śledzących metodologię ICT
- Traderów szukających jasnych sygnałów przełamania struktury
- Entuzjastów analizy wielookresowej
- Osób chcących automatycznego monitoringu struktury rynku
⚙️ Łatwa konfiguracja
- Dodaj wskaźnik do wykresu
- Ustaw preferowany wyższy interwał do analizy struktury
- Dostosuj kolory i style do swojego stylu handlu
- Włącz alerty dla powiadomień w czasie rzeczywistym
- Rozpocznij handel z profesjonalnymi wskazówkami dotyczącymi struktury rynku
💡 Zastosowania handlowe
- Podążanie za trendem: Używaj sygnałów BOS do zajmowania pozycji zgodnych z trendem
- Handel odwróceń: Sygnały MSS ostrzegają o potencjalnych zmianach trendu
- Potwierdzenie wybicia: Weryfikuj transakcje wybicia za pomocą analizy struktury
- Kontekst rynkowy: Zrozum ogólną strukturę rynku na pierwszy rzut oka
Jest darmowy do 31/12/2025, korzystaj!!!
Podsumowanie
Key features include customizable sensitivity settings for swing bar parameters, color-coded bullish and bearish signals, and multiple display options to show or hide BOS and MSS independently. Users can adjust detection criteria between body-only or body-plus-wick breaks and customize visual elements such as colors, line styles, and widths.
The indicator provides smart alerts with on-chart text and optional audio notifications, ensuring signals remain consistent without repainting. It is suitable for price action traders, ICT methodology followers, and those seeking automated market structure monitoring with institutional-level insights.
Setup involves adding the indicator to a chart, selecting a higher timeframe for analysis, customizing visual styles, and enabling alerts. Trading applications include trend following, reversal trading, breakout confirmation, and gaining overall market structure awareness.
Opinie klientów
5 | 100 % | |
4 | 0 % | |
3 | 0 % | |
2 | 0 % | |
1 | 0 % |