

Açıklama
🚀 Risk Appetite & Directional Bias ULTRA (cTrader), Risk-On / Neutral / Risk-Off koşullarını ölçmek ve bunları net, uygulanabilir bir yönsel eğilime dönüştürmek için tasarlanmış profesyonel bir piyasa rejimi göstergesidir. Tek bir piyasaya dayanmak yerine, iki enstrümanı (“risk vekili” ve “kıyaslama”) karşılaştırarak gerçek zamanlı bir Risk Skoru (0–100) oluşturur, rejim geçişlerini vurgular ve her şeyi grafik üzerinde bir gösterge paneli ile özetler.
🔧 İlk iki parametrenin anlamı (ve neden önemli oldukları)
🟠 Risk Varlık Sembolü (BTC)
Bu, risk vekilidir — “risk iştahı termometresi” olarak kullanılan enstrümandır. Orijinal konsept Bitcoin’i küresel risk-on vekili olarak kullandığı için “BTC” olarak etiketlenmiştir, ancak Bitcoin kullanmak zorunda değilsiniz. Risk duyarlılığını iyi temsil eden herhangi bir varlığa ayarlayabilirsiniz (örneğin, BTC, NASDAQ/US100, yüksek beta endeksleri vb.).
🔵 Kıyaslama Sembolü (SP/US500)
Bu, makro eğilim için takip etmek istediğiniz referans piyasadır (kıyaslama). Genellikle US500/SPX500 olur, ancak ana “bağlam sürücünüz” olarak kabul ettiğiniz herhangi bir enstrüman olabilir.
✅ Kısaca:
- Risk Varlık = duyarlılık sensörü (risk iştahı kaynağı)
- Kıyaslama = eğilimin yansımasını istediğiniz referans piyasa
❓ Bitcoin üzerinde kullanmak zorunda mıyım?
Hayır. Göstergeleri amacınıza bağlı olarak farklı şekillerde kullanabilirsiniz:
✅ A) Makro “klasik” Risk-On/Risk-Off (önerilen)
- Risk Varlık: BTCUSD
- Kıyaslama: US500 / SPX500
Bu, küresel risk rejimlerinin net bir görünümünü sağlar.
✅ B) Bitcoin’i makro bağlamla işlem yapmak
- Risk Varlık: BTCUSD
- Kıyaslama: US500 (veya başka bir makro referans)
Bu, makro koşulların BTC’yi ne zaman desteklediğini veya karşı çıktığını anlamanıza yardımcı olur.
✅ C) Çoklu varlık / özel piyasa ilişkileri
- Risk Varlık: BTC veya US100
- Kıyaslama: filtrelemek istediğiniz piyasa (GER40, XAUUSD, vb.)
Bu, göstergenin esnek bir “duyarlılık motoruna” dönüşmesini sağlar.
⚙️ Nasıl çalışır (temel mantık)
Model her iki sembolde aşağıdakileri hesaplar:
📈 Getiriler (%) (isteğe bağlı olarak daha stabil olması için logaritmik)
📊 Volatilite (seçilen geri bakış süresi boyunca standart sapma)
🔗 Hareketli korelasyon iki getiri serisi arasında
🎛️ Dinamik Ağırlık risk vekilinin etkisini şu temellere göre ayarlar:
- korelasyon gücü
- göreceli volatilite
Bu, Ayarlanmış Değişim sinyali üretir ve bu sinyal:
- EMA ile yumuşatılmıştır
- bir 0–100 Risk Skoru olarak normalize edilmiştir
📊 Nasıl okunur (en önemli sinyaller)
🎯 Risk Skoru (0–100) ana pusulanızdır:
🟢 Risk-On (skor üst eşik değerinin üzerinde, örn. > 60)
→ risk iştahı güçlüdür, ortam genellikle momentum/risk varlıklarını destekler
🔵 Nötr (alt ve üst eşik değerleri arasında, örn. 40–60)
→ geçiş / kararsızlık / karışık sinyaller, filtreleme önerilir
🔴 Risk-Off (skor alt eşik değerinin altında, örn. < 40)
→ savunmacı ortam, dikkat daha yüksek, aşağı yönlü risk genellikle artmıştır
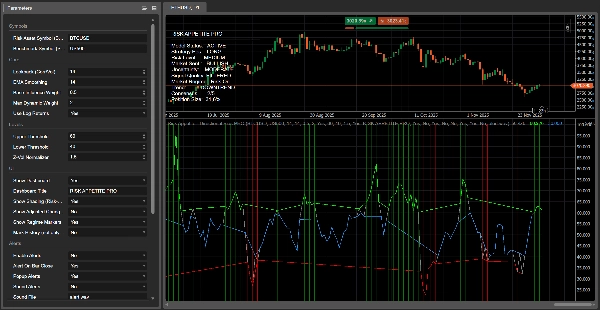
🔴 Kırmızı çizginin neden “koptuğu” (ve ne anlama geldiği)
Bu ULTRA versiyonunda görselleştirme kasıtlı ve “rejim tabanlıdır”:
- Sürekli bir temel çizgi (gri) her zaman görünürdür
- Renkli örtüşmeler sadece kendi rejimlerinde görünür:
-
- Kırmızı örtüşme sadece Risk-Off sırasında
- Yeşil örtüşme sadece Risk-On sırasında
- Mavi örtüşme Nötr sırasında
Piyasa Risk-Off’tan çıkarak Nötr (veya Risk-On) durumuna geçtiğinde, kırmızı örtüşme boş (NaN) olur ve cTrader çizimi durdurur—bu yüzden “kesiliyormuş” gibi görünür. ✅
📌 Önemli: bu, otomatik olarak ayı trendinin “bittiği” anlamına gelmez.
Model artık güçlü, doğrulanmış Risk-Off koşullarını algılamıyor, bu yüzden ayı yönlü avantaj azalır ve piyasa muhtemelen geçiş halindedir.
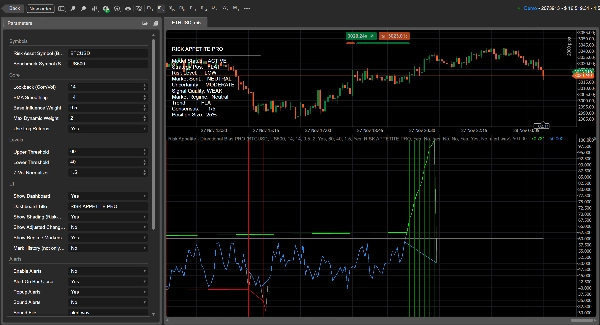
🖥️ Grafik üzerindeki gösterge (gösterge paneli) ne işe yarar — satır satır açıklama
Gösterge paneli sizin gerçek zamanlı karar panelinizdir. Rejimi, güveni ve taktik rehberliği özetler, böylece sadece çizgiden tahmin yapmanız gerekmez.
✅ Model Durumu
Modelin doğru çalışıp çalışmadığını gösterir.
- AKTİF = geçerli veri mevcut ve hesaplamalar doğru
- VERİ YOK = sembol verisi eksik, sembol adı yanlış veya yeterli geçmiş/zaman hizalaması yok
🎯 Strateji Pozisyonu (Strategy Pos)
Rejime dayalı önerilen duruş:
- UZUN = Risk-On
- KISA = Risk-Off
- DÜZ = Nötr
⚠️ Risk Seviyesi
Piyasa volatilitesi ve belirsizliğine dayalı bir risk yoğunluğu ölçüsü.
- ÇOK DÜŞÜK / DÜŞÜK = daha stabil koşullar
- ORTA = normal
- YÜKSEK / ÇOK YÜKSEK = daha fazla gürültü, daha yüksek whipsaw riski; pozisyon büyüklüğünü azaltın veya daha güçlü onay isteyin
🧠 Piyasa Duyarlılığı
Skor seviyesinden türetilen yönsel ton:
- BOĞA / AYA / NÖTR
🌫️ Belirsizlik
Modelin ne kadar “net” olduğunu gösterir. Şu durumlarda artar:
- korelasyon zayıflar veya
- volatilite yükselir (daha istikrarsız ortam)
Düzeyler: DÜŞÜK / ORTA / YÜKSEK
🧪 Sinyal Kalitesi
Şu temellere dayalı birleşik bir derecelendirme:
- sinyal gücü (50’den uzaklık)
- belirsizlik seviyesi
Çıktılar: GÜÇLÜ / FİLTRELENMİŞ / ZAYIF
🔥 Piyasa Rejimi
Ana sınıflandırma:
- Risk-On / Nötr / Risk-Off
Bu, renk örtüşmelerini, gölgelendirmeyi ve pozisyon eğilimini yönlendiren temel rejim durumudur.
📉 Trend
Skorun kısa vadeli yönü (eğim):
- YUKARI TREND = artan risk iştahı
- AŞAĞI TREND = azalan risk iştahı
- DÜZ = yatay / düşük momentum
🗳️ Konsensüs (X/5)
Anahtar koşulların (yön, eğim, korelasyon uyumu vb.) kaçının uyduğunu sayan basit bir uyum skoru.
Yüksek = daha temiz, daha tutarlı ortam.
📏 Pozisyon Büyüklüğü
Sinyal gücü ve belirsizliğe dayalı önerilen maruz kalma yüzdesi:
- güçlü ve düşük belirsizlik → daha yüksek büyüklük önerisi
- zayıf veya belirsiz → daha küçük büyüklük önerisi
🧭 Çoklu zaman dilimi avantajı (pratikte çok güçlü)
Aynı piyasayı birden fazla zaman diliminde analiz ettiğinizde, gösterge her zaman dilimi için güncellenir ve yeniden hizalanır. Bu sayede kolayca fark edebilirsiniz:
✅ Zaman dilimi uyumu (daha güçlü sinyaller)
✅ Zaman dilimi çatışması (genellikle daha nötr/kararsız koşullar)
Daha yüksek zaman dilimleri makro rejimi tanımlar, daha düşük zaman dilimleri ise bu rejim içinde giriş zamanlamalarına yardımcı olur.
📌 İşaretçiler, uyarılar ve bildirimler (ULTRA özellikleri)
✨ Rejim işaretçileri rejim değiştiğinde grafikte görünür:
- Risk-On ↔ Nötr ↔ Risk-Off
Bu, geçişleri anında görünür kılar.
🔔 Uyarılar ve bildirimler etkinleştirilebilir, böylece şunları alırsınız:
- açılır uyarılar (ve isteğe bağlı ses)
- bar kapanışında uyarılar (mum oluşurken yanlış tetiklemeleri önlemek için önerilir)
💬 (optimizasyonlar + ön ayarlar + araçlar) topluluğumuza katılın
Bu göstergeden en iyi performansı almak ister misiniz? Discord topluluğumuza katılın:
✅ broker sembolleri için parametre optimizasyonu
✅ kullanıma hazır ön ayarlar (Kripto / Endeksler / FX)
✅ çoklu zaman dilimi kurulum rehberliği
✅ sinyal filtreleme ve yürütme kalitesini artıran gelişmiş araçlar ve güncellemeler
Özet
Müşteri değerlendirmeleri
5 | 100 % | |
4 | 0 % | |
3 | 0 % | |
2 | 0 % | |
1 | 0 % |


