
Opis
Super Trend Oscillator
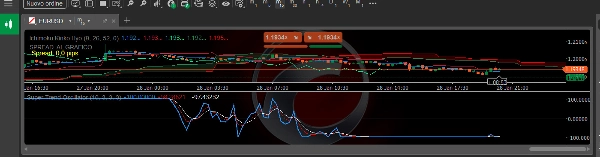
Super Trend Oscillator – wskaźnik cTrader
Opis
Super Trend Oscillator to autorski wskaźnik momentum i siły trendu zaprojektowany dla cTrader, stworzony, aby przekształcić klasyczną koncepcję SuperTrend w płynny, wyśrodkowany oscylator.
Łącząc logikę SuperTrend opartą na ATR z wielopoziomowym wygładzaniem EMA, wskaźnik ten dostarcza jasny wgląd w kierunek rynku, przyspieszenie momentum oraz jakość trendu, co czyni go idealnym do skalpowania i krótkoterminowego handlu na niskich interwałach czasowych, takich jak M1.
W przeciwieństwie do tradycyjnych wskaźników trendu, Super Trend Oscillator oscyluje wokół linii zerowej, umożliwiając traderom łatwe rozpoznanie presji byków i niedźwiedzi, zmian momentum oraz potencjalnych kontynuacji lub spowolnień trendu.
Jak to działa
- Używa obliczeń SuperTrend opartych na ATR do określenia dynamicznego kierunku rynku.
- Konwertuje odległość między ceną a SuperTrend na znormalizowany oscylator.
- Stosuje podwójne wygładzanie EMA, aby zmniejszyć szumy przy jednoczesnym zachowaniu szybkiej reakcji na ruchy cen.
- Wartości są wyśrodkowane wokół 0, z kontrolowanym zakresem dla spójnej interpretacji wizualnej.
Kluczowe cechy
- 📊 Wyśrodkowany oscylator (zakres ±100)
Wyraźna wizualizacja momentum byków/niedźwiedzi. - ⚡ Szybki i responsywny
Optymalizowany pod kątem niskich interwałów czasowych i warunków rynku o wysokiej częstotliwości. - 🧠 Hybryda trendu i momentum
Łączy kierunek trendu z siłą momentum w jednym wskaźniku. - 🎯 Struktura wieloliniowa
Główna linia oscylatora z liniami sygnału i wolnego wygładzania dla potwierdzenia. - 🔄 Bez przerysowań
Używa wyłącznie obliczeń na zamkniętych słupkach.
Zastosowania handlowe
- Potwierdzenie trendu na interwałach M1–M5
- Filtr momentum dla zautomatyzowanych systemów handlowych (cBoty)
- Strategie skalpowania i handlu intraday
- Timing wejścia i walidacja siły trendu
Najlepiej używać z
- Strategie trendowe oparte na EMA
- Systemy price action i wybicia
- Zautomatyzowane boty handlowe wymagające filtra momentum
Zastrzeżenie
Ten wskaźnik jest narzędziem analizy technicznej i nie gwarantuje zysków. Zawsze testuj i optymalizuj go zgodnie ze swoim stylem handlu i zasadami zarządzania ryzykiem.
Podsumowanie
Opinie klientów
5 | 100 % | |
4 | 0 % | |
3 | 0 % | |
2 | 0 % | |
1 | 0 % |


