

Opis
POMYSŁ
Kanał Donchiana, który dodaje kontekst zakresu z wyższego interwału czasowego zamiast oglądać każdy wybicie w izolacji.
PROBLEM
Standardowy kanał Donchiana informuje, kiedy cena osiąga ostatni ekstremum.
Ale wybicie nie dzieje się w izolacji.
Wybicie na M15 może być istotne — lub może to być po prostu ruch ceny wewnątrz znacznie większego zakresu dziennego lub tygodniowego.
To samo wybicie może mieć więc bardzo różny kontekst w zależności od tego, gdzie występuje w ramach zakresu z wyższego interwału czasowego.
Kanał pokazuje wybicie. Ale sam kanał nie pokazuje, gdzie to wybicie znajduje się w większym zakresie.
GŁÓWNA KONCEPCJA: KANAŁ POKAZUJE RUCH. WYŻSZY INTERWAŁ CZASOWY POKAZUJE, GDZIE SIĘ TO DZIEJE.
Wybicie to nie tylko zdarzenie.
Ma też lokalizację.
Dwa wybicia mogą wyglądać identycznie na interwale wykonawczym, a jednocześnie występować w bardzo różnych pozycjach w ramach zakresu z wyższego interwału czasowego.
Jedno może wystąpić blisko środka większego zakresu.
Drugie może wystąpić bezpośrednio wewnątrz jego górnej granicy.
Akcja cenowa może wyglądać tak samo.
Kontekst nie.
Ten wskaźnik sprawia, że ten kontekst jest widoczny, umieszczając poprzedni zakończony zakres z wyższego interwału czasowego bezpośrednio na Twoim aktualnym wykresie.
Zamiast pytać tylko:
"Czy cena przebiła kanał?"
możesz także zapytać:
"Gdzie nastąpiło wybicie?"
CO TO ROBI
Kanał Donchiana z kontekstem interwału czasowego łączy dwie warstwy informacji na jednym wykresie:
1. Donchian na bieżącym interwale
Standardowy kanał Donchiana śledzi ostatni szczyt, dołek i punkt środkowy bieżącego rynku.
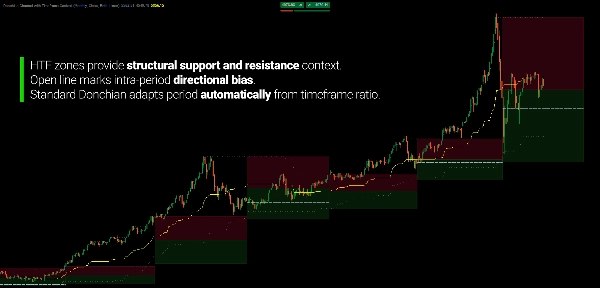
Jego okres jest obliczany automatycznie na podstawie stosunku między interwałem Twojego wykresu a wybranym interwałem kontekstu. Na przykład kontekst tygodniowy na wykresie H1 daje okres cofania się o 120 świec.
Nie musisz decydować, czy kanał powinien używać 20, 50 czy 100 świec.
Relacja interwałów definiuje okres cofania się.
2. Kontekst wyższego interwału
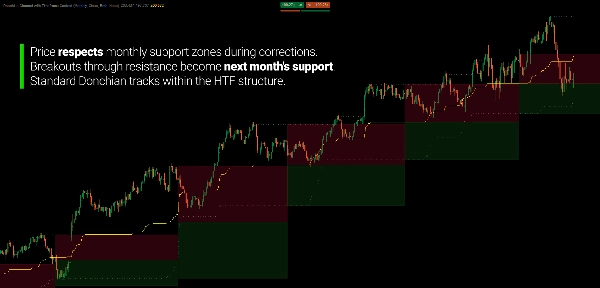
Zakres poprzedniego zakończonego okresu z wyższego interwału jest rzutowany na Twój aktualny wykres jako strefy wsparcia i oporu.
Jego zakres jest podzielony na dwie części:
Strefa wsparcia
Od dołka poprzedniego okresu do jego punktu środkowego.
Strefa oporu
Od punktu środkowego do szczytu poprzedniego okresu.
W miarę rozwoju ceny na Twoim bieżącym interwale możesz od razu zobaczyć jej pozycję w tym większym zakresie.
DWA INTERWAŁY. JEDEN WYKRES.
Donchian na bieżącym interwale pokazuje ruch rozwijający się wokół ostatnich ekstremów.
Zakres z wyższego interwału dostarcza większą ramę odniesienia.
Na przykład:
Kontekst tygodniowy → wykres H1
lub
Kontekst dzienny → wykres M5
Niższy interwał pozostaje aktywnym ruchem.
Wyższy interwał po prostu dostarcza otaczający zakres.
Kanał pokazuje, co robi cena. Wyższy interwał pokazuje, gdzie się to dzieje.
WYŻSZY INTERWAŁ NIE NADPISUJE NIŻSZEGO
Zakres z wyższego interwału nie jest sygnałem mówiącym, co cena musi zrobić.
Jest to rama odniesienia.
Wybicie na niższym interwale może kontynuować przez opór z wyższego interwału.
Cofnięcie może zatrzymać się wewnątrz wsparcia z wyższego interwału.
Cena może również całkowicie wyjść poza poprzedni zakres i wejść na nowe terytorium.
Celem nie jest przewidywanie, który wynik nastąpi.
Chodzi o uczynienie większego zakresu widocznym, podczas gdy obserwujesz rozwijający się mniejszy ruch.
POZWÓL KONTEKSTOWI SIĘ AKTUALIZOWAĆ
Strefy z wyższego interwału opierają się na poprzednim zakończonym okresie.
Gdy zaczyna się nowy okres z wyższego interwału, zakres kontekstu się aktualizuje.
Na przykład:
Poprzedni tydzień → bieżący tydzień
Szczyt, dołek i punkt środkowy poprzedniego tygodnia stają się odniesieniem dla bieżącego tygodnia.
Na wykresie H1 te granice pozostają widoczne, podczas gdy kanał Donchiana dla bieżącego okresu nadal się rozwija.
Dzięki temu masz trwałe odniesienie bez ręcznego rysowania zakresu poprzedniego okresu.
KONTEKST INTERWAŁU TO TWÓJ WYBÓR
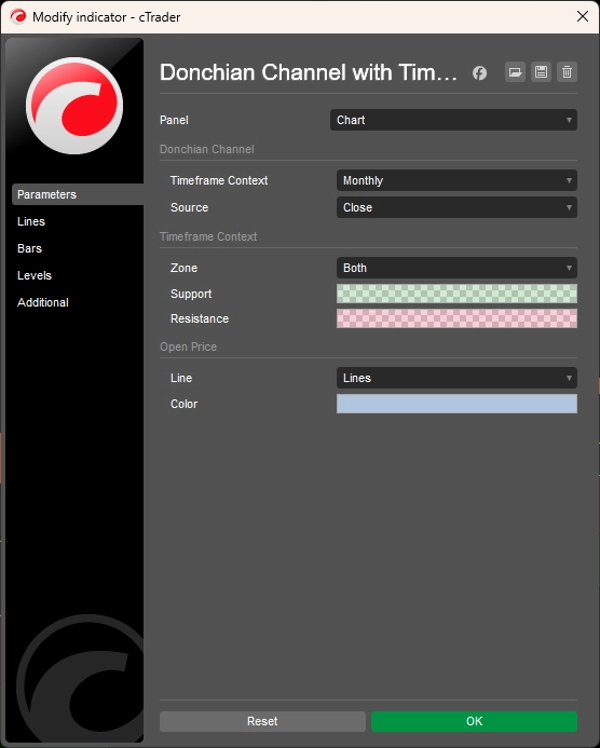
Wybierz wyższy interwał, który dostarcza kontekst, jaki chcesz:
- Miesięczny
- Tygodniowy
- Dzienny
- 4 godziny
- 1 godzina
- 30 minut
- 15 minut
- I inne obsługiwane kombinacje
Wskaźnik automatycznie obsługuje odpowiadający okres Donchiana.
Ty wybierasz kontekst. Obliczenia dostosowują się do niego.
OPCJONALNE ODNIESIENIE DO CENY OTWARCIA
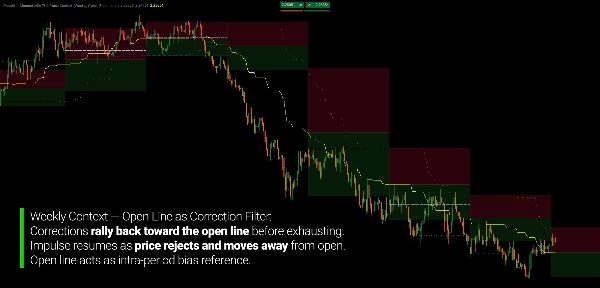
Można również wyświetlić cenę otwarcia bieżącego okresu z wyższego interwału.
Daje to kolejne odniesienie, gdzie cena handluje względem ceny otwarcia bieżącego okresu z wyższego interwału.
Włącz to, gdy chcesz dodatkowego kontekstu.
Ukryj, gdy chcesz, aby wykres skupiał się na dwóch warstwach Donchiana.
WYBIERZ, JAK OBLICZANY JEST KANAŁ
Granice Donchiana mogą być obliczane na podstawie:
Zamknięcia
lub
Szczytu / Dołka
Obliczenia na podstawie zamknięć dają granice z cen zamknięcia.
Obliczenia na podstawie szczytów/dołków obejmują pełne ekstremalne knoty i dlatego reprezentują szerszy zakres cenowy.
Ten sam wybór źródła jest stosowany konsekwentnie zarówno do obliczeń na bieżącym, jak i wyższym interwale.
STWORZONY DLA KONTEKSTU, NIE DLA ŚCIGANIA SYGNAŁÓW
Kanał Donchiana z kontekstem interwału czasowego nie jest systemem przewidywania wybicia.
Nie mówi Ci, czy wybicie się powiedzie.
Daje Ci zdefiniowane środowisko, w którym możesz je obserwować.
Używaj go do badania:
- Wybicia
- Cofnięcia
- Granice z wyższego interwału
- Pozycję w większym zakresie
- Ekspansję poza poprzednie ekstremum
- Geometrię cen wielointerwałową
- Bieżący ruch względem poprzedniego okresu
Standardowy Donchian mówi Ci, gdzie są bieżące ekstremum.
Kontekst z wyższego interwału mówi Ci, gdzie te ekstremum znajdują się w większym zakresie.
KLUCZOWE CECHY
- Standardowy kanał Donchiana
- Automatyczne obliczanie okresu dla bieżącego interwału
- Projekcja zakresu z wyższego interwału
- Strefy kontekstowe wsparcia i oporu
- Szczyt, dołek i punkt środkowy poprzedniego okresu
- 13 wybieralnych kontekstów interwału, od miesięcznego do 15-minutowego
- Opcjonalna cena otwarcia z wyższego interwału
- Tryby obliczeń: na podstawie zamknięcia lub szczytu/dołka
- Konfigurowalny wyświetlacz stref: oba, tylko wsparcie, tylko opór lub brak
- Opcje wyświetlania tylko wsparcia / tylko oporu
- Aktualizacje w czasie rzeczywistym
- Wsparcie dla wykresów opartych na czasie i nieopartych na czasie, w tym Tick, Renko i Range
---
Trading wiąże się z ryzykiem. Ten wskaźnik jest narzędziem analizy technicznej i powinien być używany razem z odpowiednim zarządzaniem ryzykiem.
Podsumowanie
This dual-layer system automatically adapts the Donchian lookback period based on the ratio between the selected higher timeframe and the chart timeframe, eliminating manual period settings. It supports 13 timeframe options from Monthly to 15 Minutes and can be applied across various markets including forex pairs (EURUSD, GBPUSD, USDJPY, NZDUSD), commodities (XAUUSD), indices (NAS100), and cryptocurrencies (BTCUSD).
Key features include real-time updates of both standard and higher-timeframe channels, configurable visual zones with adjustable colors and transparency, an optional open price line marking the higher-timeframe period’s open, and flexible price source settings (close or high/low).
The indicator aids traders in filtering false breakouts by showing whether price movements occur within structural supply or demand zones on a higher timeframe. It is designed for trend-following, swing, and discretionary traders who use Donchian channels and seek enhanced structural context to better assess breakout significance and correction exhaustion without switching timeframes.
Opinie klientów
Dyskusja
Częste pytania














![Logo „Gaussian Channel [Iridio Capital]”](https://cdn.ctrader.com/image/webp/2c4f9ca9-4e9b-476d-b5a6-787c8095032b_61546)







![Logo „Smart Money Concepts (SMC) [Iridio Capital]”](https://cdn.ctrader.com/image/webp/b4b5414d-a5ca-44b7-a947-e28eca44a218_61548)
Cena