Opis
🚀 Przekształć swój wykres w strategiczne centrum decyzyjne
Smart Tech Analysis to nie tylko wskaźnik.
To kompletna inteligentna tablica analityczna, stworzona dla traderów, którzy chcą jasności, precyzji i zwinności w podejmowaniu decyzji.
Podczas gdy większość wskaźników dostarcza tylko izolowane informacje, Smart Tech Analysis integruje:
✔ Trend
✔ Wolumen
✔ Fibonacci
✔ Wsparcie i opór
✔ Sygnały techniczne
✔ Operacyjne rekomendacje
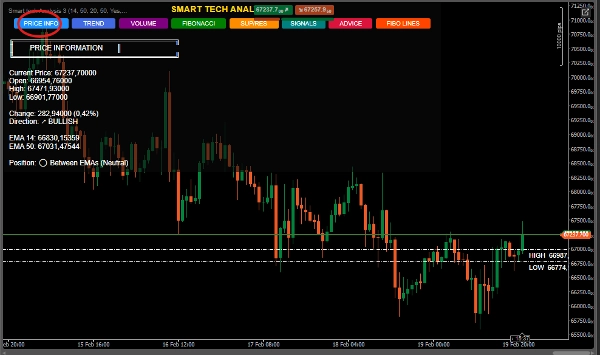
✔ Szczegółowe informacje o cenie
Wszystko w jednej dynamicznej i interaktywnej tablicy.
🔥 DUŻA RÓŻNICA
🎯 1. System 6 w 1 – Zintegrowana analiza
Nie musisz już przełączać się między wieloma wskaźnikami.
Smart Tech Analysis łączy:
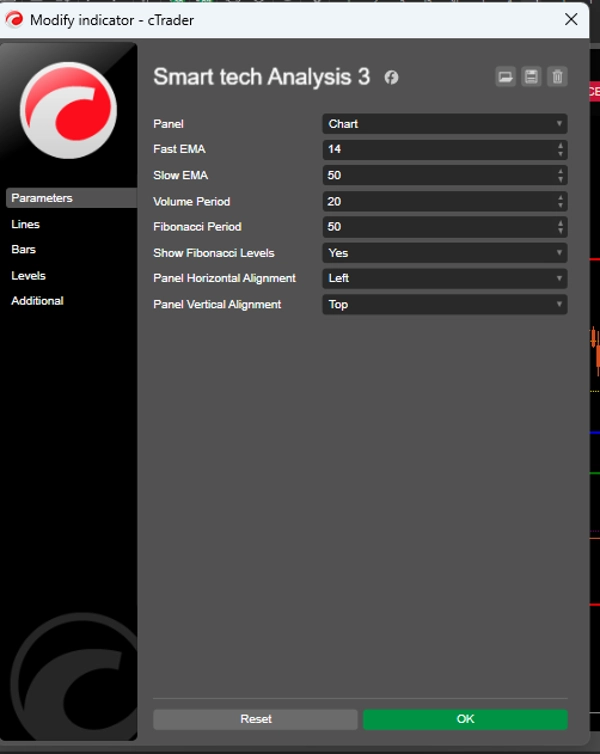
📈 Szybkie i wolne EMA (14 i 50)
📊 Wolumen z analizą porównawczą
🧩 Automatyczny Fibonacci
🛡 Dynamiczne wsparcie i opór
🚦 Inteligentne generowanie sygnałów
📌 Rekomendacje z obliczonym stopem i celem
👉 To redukuje wizualny szum i zwiększa obiektywność.
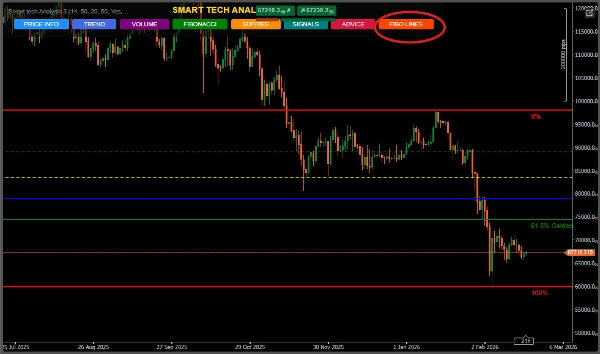
🧠 2. Ekskluzywny panel interaktywny
Profesjonalny interfejs z inteligentnymi przyciskami:
INFORMACJE O CENIE
TREND
WOLUMEN
FIBONACCI
WSPARCIE/OPÓR
SYGNAŁY
PORADY
Trader wybiera dokładnie to, co chce widzieć.
📌 Organizacja.
📌 Kontrola.
📌 Profesjonalizm.
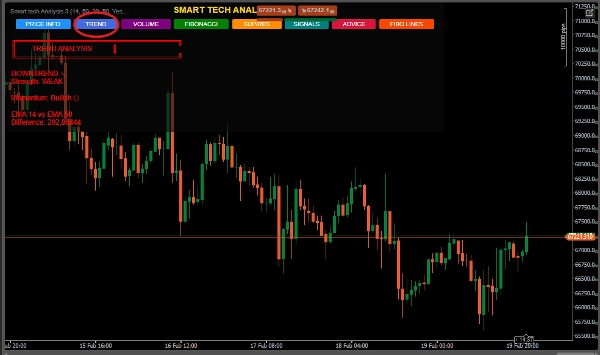
📈 3. Analiza trendu z siłą i momentum
Nie pokazuje tylko, czy rośnie czy spada.
Oblicza:
Intensywność trendu
Procentową siłę między EMA
Klasyfikację: Słaby, Umiarkowany lub Silny
Unika słabych wejść na rynkach bocznych.
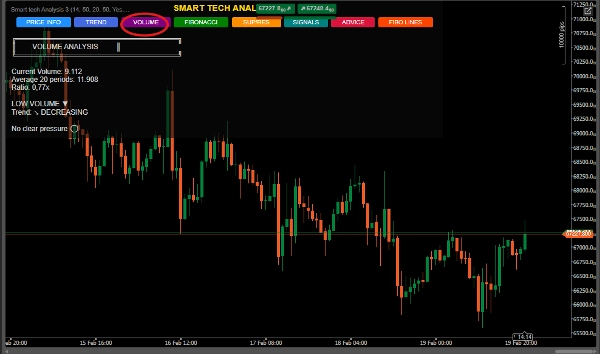
📊 4. Wolumen z odczytem instytucjonalnym
System identyfikuje:
Ekstremalny wolumen
Presję kupna lub sprzedaży
Przyspieszenie lub zwolnienie
Porównanie ze średnią historyczną
👉 Idealne do wykrywania możliwej aktywności instytucjonalnej.
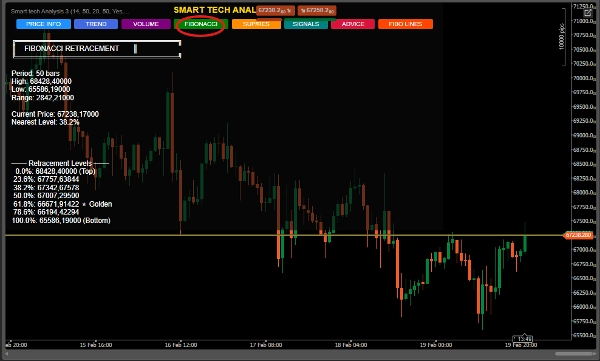
🧩 5. Automatyczny Fibonacci ze strefą złotą
Obliczany dynamicznie na określonym okresie.
Specjalne wyróżnienie dla:
⭐ Strefa 61,8% (Strefa złota)
📌 Identyfikacja najbliższego poziomu
📌 Rozszerzenia bycze i niedźwiedzie
📌 Automatyczna rekomendacja kontekstowa
Idealne dla traderów retracement i swingowych.
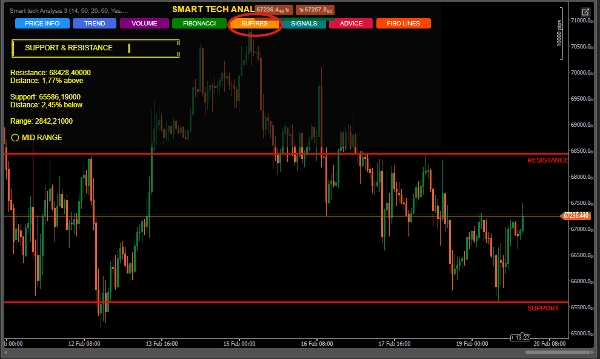
🛡 6. Inteligentne wsparcie i opór
Wykrywa istotne maksima i minima
Pokazuje procentową odległość od aktualnej ceny
Klasyfikuje pozycję: Blisko wsparcia, oporu lub w środku zakresu
Rysuje automatyczne linie na wykresie
Idealne do wchodzenia w strategiczne strefy.
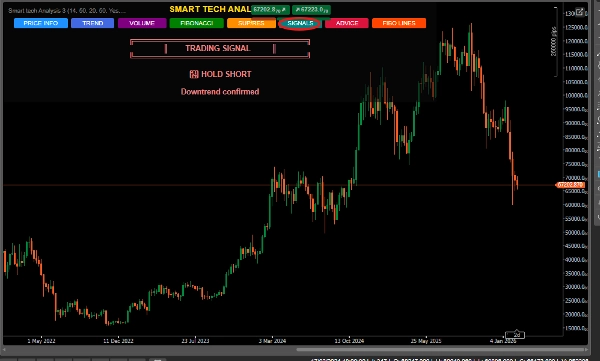
🚦 7. System sygnałów konfluencji
Algorytm nie generuje losowych sygnałów.
Łączy:
✔ Przecięcie EMA
✔ Bliskość wsparcia/oporu
✔ Strukturę trendu
✔ Kontekst cenowy
Klasyfikacja:
🟢 SILNY KUP
🔴 SILNA SPRZEDAŻ
📈 TRZYMAJ DŁUGO
📉 TRZYMAJ KRÓTKO
⏸ CZEKAJ
Z wskazanym poziomem pewności.
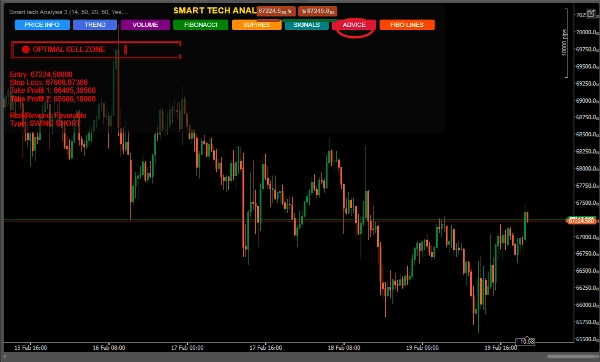
🎯 8. Rekomendacje z zarządzaniem ryzykiem
Panel "PORADY" dostarcza:
Sugerowane wejście
Techniczny Stop Loss
Dwa cele Take Profit
Strukturę swingową (Long lub Short)
Kontekst operacji
👉 To nie tylko analiza.
👉 To uporządkowany plan.
🏆 Dla kogo jest ten wskaźnik?
✔ Początkujący traderzy, którzy potrzebują jasności
✔ Traderzy średniozaawansowani, którzy chcą konfluencji
✔ Zaawansowani traderzy szukający efektywności
✔ Traderzy swingowi
✔ Scalperzy korzystający z potwierdzenia strukturalnego
💎 Dlaczego wyróżnia się na rynku? Wskaźniki powszechne Smart Tech Analysis
Izolowane informacje Zintegrowana analiza Zanieczyszczenie wizualne Zorganizowana tablica Brak kontekstu Techniczna konfluencja Brak zarządzania Sugerowany stop i cel Proste sygnały Sygnały z potwierdzeniem
📊 Bezpośrednie korzyści
✔ Redukuje emocjonalne decyzje
✔ Zwiększa dokładność
✔ Poprawia czytanie strukturalne
✔ Oszczędza czas
✔ Podnosi profesjonalny poziom tradera
🧠 Pozycjonowanie na rynku
Smart Tech Analysis jest idealny dla:
Rynku Forex
Indeksów
Towarów
Kryptowalut


