MACD Custom Indicator - Multiple Time Frame
Wskaźnik
Wersja 1.0, May 2026
Windows, Mac
4.0
Opinie: 2
Trading product for MACD Custom Indicator - Multiple Time Frame Wskaźnik EMA Volume, image 2
Trading product for MACD Custom Indicator - Multiple Time Frame Wskaźnik EMA Volume, image 3
Trading product for MACD Custom Indicator - Multiple Time Frame Wskaźnik EMA Volume, image 4
Trading product for MACD Custom Indicator - Multiple Time Frame Wskaźnik EMA Volume, image 5
46
Sprzedaż
3.93K
Bezpłatne instalacje

Opis

🔥 **PrimeQuant CM Ultimate MACD MTF v1.0** 🔥


**Idealna aktualizacja MACD z TradingView do cTrader**

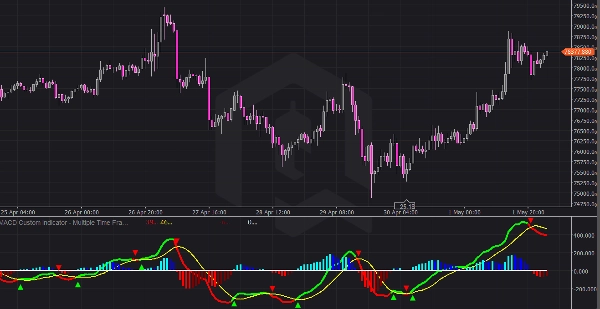
✅ Dokładna wizualna replika słynnego CM MACD Ultimate MTF Pine Script

✅ Obsługa wielu interwałów czasowych (bieżący wykres lub niestandardowy HTF)

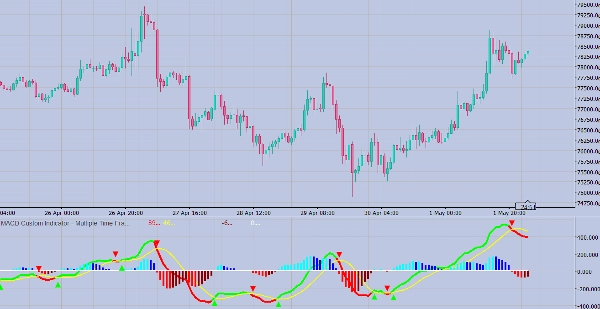
✅ Ciągła linia MACD z dynamicznym zielono/czerwonym kolorowaniem trendu

✅ Żółta linia sygnału

✅ Czterokolorowy histogram (przejścia powyżej/poniżej zera)

✅ Trójkątne sygnały przecięcia (strzałki w górę/w dół z idealnym odstępem)

✅ Linia odniesienia zero


**🎯 Kluczowe cechy:**

- **📊 Elastyczność MTF**: Użyj bieżącego interwału lub wybierz niestandardowy HTF (1m-1M)

- **🎨 Inteligentne kolorowanie**: Linia MACD zmienia kolor na zielony/czerwony przy przecięciu sygnału

- **📈 Czterokolorowy histogram**: Aqua/niebieski powyżej zera, czerwony/bordowy poniżej

- **🔺🔻 Sygnały trójkątne**: Czyste strzałki w górę/w dół w punktach przecięcia

- **⚙️ Pełna personalizacja**: Możliwość niezależnego włączania każdego elementu


**🚀 Jak używać:**

1. **Dodaj do wykresu** → Pojawia się w osobnym panelu

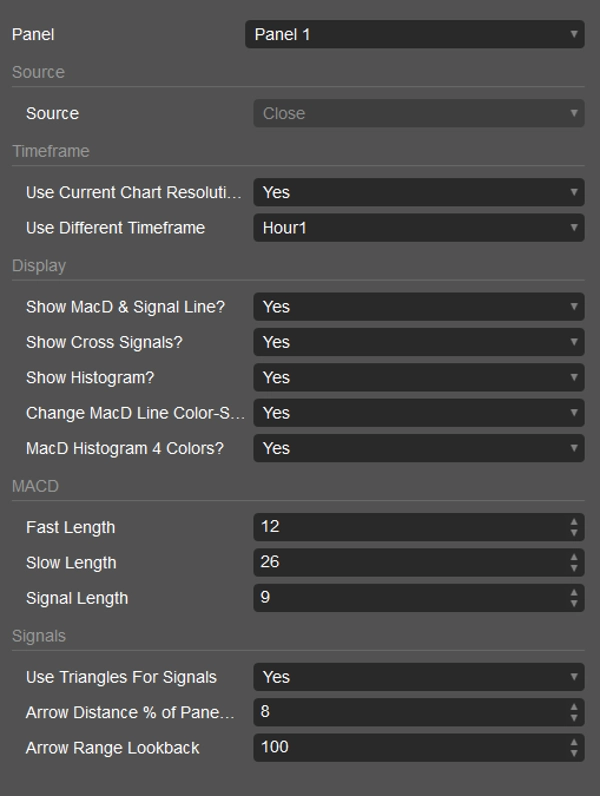
2. **Bieżący TF** → Zaznacz "Użyj bieżącej rozdzielczości wykresu" (domyślnie)

3. **Wyższy TF** → Odznacz + wybierz interwał (np. H1 na wykresie M5)

4. **Sygnały** → Włącz "Pokaż sygnały przecięcia" dla znaczników trójkątnych

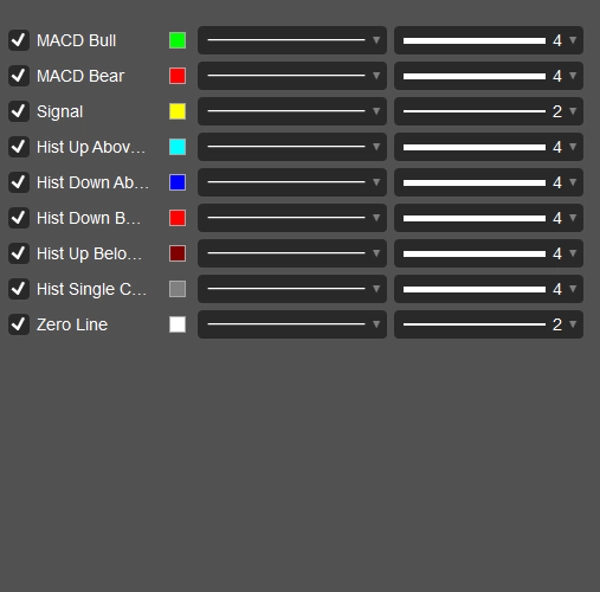
5. **Dostosuj** → Zmień kolory, odległości, style histogramu


**📈 Sygnały handlowe:**

- 🔺 **Zielony trójkąt w górę** = MACD przecina sygnał OD GÓRY (byczy)

- 🔻 **Czerwony trójkąt w dół** = MACD przecina sygnał OD DOŁU (niedźwiedzi)

- **Zielony MACD** = Powyżej sygnału (bycze nastawienie)

- **Czerwony MACD** = Poniżej sygnału (niedźwiedzie nastawienie)

- **Dywergencja histogramu** = Obserwuj zmiany momentum


**💎 Jakość PrimeQuant**

Stworzony dla cTrader 5.6.10+ | Zero błędów | Wydajność natywna | Profesjonalna wizualizacja


**⭐ Idealny dla:** Skalperów, traderów swingowych, analizy HTF na niższych wykresach

Podsumowanie

Podsumowanie AI
The MACD Custom Indicator - Multiple Time Frame is a momentum indicator designed for the cTrader platform, replicating the visual style of the CM MACD Ultimate MTF Pine Script from TradingView. It supports multi-timeframe analysis, allowing users to apply the MACD calculation on the current chart timeframe or select a custom higher timeframe ranging from 1 minute to 1 month. The indicator features a continuous MACD line that dynamically changes color (green/red) based on trend direction, a yellow signal line, and a four-color histogram that visually distinguishes momentum shifts above and below zero. Triangle-shaped cross signals mark bullish and bearish MACD-signal line crossovers with up and down arrows, respectively. A zero reference line is also included for trend context. Users can fully customize the display elements independently, including colors, distances, and histogram styles. The indicator appears in a separate panel on the chart and is suitable for scalpers, swing traders, and higher timeframe analysis on lower timeframe charts. It provides visual signals for trend strength, crossovers, and potential momentum divergences to assist in trading decisions.
Profil wskaźnika
Kategoria wskaźnika
Dynamika
Typ wyjścia
Wizualizacja
Sygnały
Wymagania dotyczące danych
Tylko słupki
Obsługiwane sygnały
Przecięcie
Dywergencja
Odwrócenie trendu
Siła trendu

Opinie klientów

4.0
Opinie: 2
5
0 %
4
100 %
3
0 %
2
0 %
1
0 %
Opinie klientów
May 17, 2026
messy signals are easier to question, but it should not replace the chart.
May 16, 2026
Demo first, then maybe small size if the notes look sane, and forcing the entry still creates problems.

Dyskusja

Częste pytania

EMA
Volume
MACD
Triangle
Moving Average
VWAP
Support & Resistance
Produkty dostępne za pośrednictwem cTrader Store, w tym boty handlowe, wskaźniki i wtyczki, dostarczane są przez deweloperów zewnętrznych i udostępniane wyłącznie w celach informacyjnych oraz w celu zapewnienia dostępu technicznego. cTrader Store nie jest brokerem i nie zapewnia doradztwa inwestycyjnego, nie udziela spersonalizowanych rekomendacji ani nie gwarantuje przyszłych wyników.

Więcej od tego autora

Wskaźnik
ATR
SMC
+19
Free Smart Money Concepts from TradingView for cTrader: BOS/CHoCH, OB, FVG, liquidity, MTF levels, discount zones.
Wskaźnik
ATR
SMC
+18
Precision SMC tool with HTF sweeps, MSS confirmation & smart FVG detection for high-probability reversals.
Wskaźnik
ATR
Prop
+16
Get the exact SuperTrend experience from TV, now perfectly rebuilt for cTrader
Wskaźnik
Prop
ZigZag
+5
All-in-One ICT/SMC Institutional Framework — Ranges, Structure, Liquidity, Fibonacci & Time Engine.
Wskaźnik
RSI
MACD
+5
WaveTrend Oscillator with signal line, spread histogram and OB/OS levels for precise momentum trading.
Wskaźnik
ATR
SMC
+19
Smart Liquidity Sweep detector with auto-drawing True Channels and real market structure mapping.
Wskaźnik
Forex
BTCUSD
+11
📈 Adaptive ALMA-Gaussian hybrid trend filter with precision smoothing and clear buy/sell signals.
Wskaźnik
SMC
Forex
+15
Smart institutional order block & FVG scanner with alerts, zone merging, and HTF confluence.
cBot
SMC
Forex
+11
💎 ICT Silver Bullet Strategy cBot — liquidity sweep & breakout algorithm with risk control.
Wskaźnik
Forex
Crypto
+5
🚀 Automated Elliott Wave & Fibonacci tool for cTrader. Spot trends, corrections & retracements fast.
Wskaźnik
ADX
ATR
+5
Precision Sniper by PrimeQuant: Advanced confluence engine with auto-presets, dynamic TP/SL, and live backtest stats.
Wskaźnik
ATR
SMC
+17
Adaptive Swing-Anchored VWAP that tracks market structure shifts with precision and clarity.

Możesz także polubić

Wskaźnik
VWAP
Volume
+2
VWAP Stdev Heatmap: Advanced daily VWAP with 5-tier standard deviation bands and dynamic candlestick coloring.
Wskaźnik
The Weekly Daily Levels indicator shows the OHLC, and mid-point prices for the previous day and week.
Wskaźnik
RSI
Breakout
+1
"Identify key market zones and visualize support/resistance from multiple timeframes on a single chart.
Wskaźnik
Prop
Forex
+11
😎Read the description before purchasing💩
Wskaźnik
Prop
Forex
+5
Pivot Point with base zone daily Asia-London-New york Session.
Wskaźnik
Prop
Forex
+11
⚡Nebula Range Filter is a professional trend filter indicator for cTrader⚡
Wskaźnik
BOS
MSS
+3
Orderblocks with Multi-Timeframe.
Wskaźnik
BOS
CHOCH
+5
MarketStructurePro – Smart BOS/CHoCH
Wskaźnik
Drawdown Monitor
Proprietary trading desk risk monitoring dashboard!
Wskaźnik
EMA
VWAP
+2
ORB Range Indicator maps the opening range and gives a practical session-breakout workflow with clear labels.
Wskaźnik
AI
Forex
+3
Smart Money FVG & Imbalance Detector – Precision Institutional Tool
Wskaźnik
ATR
BOS
+3
Fair Value Gaps with Multi-Timeframe.
Wskaźnik
AI
ATR
+27
VolumeProfileSuite is an advanced and flexible Volume Profile indicator for cTrader.
Wskaźnik
SMC
Prop
+12
Multi-TF FVG + Smart Fibonacci
Wskaźnik
Prop
VWAP
+15
VWAP: Follow the smart money. Trade with real volume and the fair price on your side!
Wskaźnik
Forex
Fibonacci
+2
Enhance your trading with customizable alerts and dynamic visual tools for trendlines, Fibonacci levels, and more.
Wskaźnik
RSI
Signal
+2
Dynamic circles visualize price's volatility position. Like RSI for market overextension & stretch. Quantify context.
Wskaźnik
ATR
The Tenkan-ATR Indicator is a powerful and innovative indicator for Traders. SALE OFF!!!

Cena

46
Sprzedaż
3.93K
Bezpłatne instalacje