Açıklama
VoltyBands, fiyat davranışını dinamik olarak izleyen ve piyasa koşullarını duyarlı üst ve alt bantlar aracılığıyla görselleştiren uyarlanabilir volatilite tabanlı bir göstergedir. Statik kanal göstergelerinin aksine, VoltyBands volatilitedeki değişimleri gerçek zamanlı olarak yansıtarak, yatırımcıların fiyat genişleme ve daralma aşamalarını daha iyi anlamalarına yardımcı olur.
Uyarlanabilir bant hesaplamalarını isteğe bağlı olarak yumuşatılmış bir sinyal hattı ile birleştirerek, VoltyBands momentumu analiz etmek, potansiyel dönüş bölgelerini belirlemek ve konsolidasyon dönemlerini tespit etmek için net bir çerçeve sunar.
Temel Özellikler
- Uyarlanabilir Volatilite Bantları
Bantlar mevcut piyasa aktivitesine bağlı olarak otomatik şekilde genişler ve daralır. - Sıfır Merkezli Mod
Daha iyi açıklık için fiyat hareketini merkezi bir referans çizgisine göre gösterme seçeneği. - Normalizasyon Seçeneği
Farklı enstrümanlar ve zaman dilimleri arasında sinyalleri karşılaştırmayı kolaylaştıran tutarlı ölçeklendirme sağlar. - Entegre Hareketli Ortalama
Seçilebilir yöntemlerle (SMA, EMA, SMMA, LWMA) yerleşik yumuşatma. - Özelleştirilebilir Görünüm
İsteğe bağlı orta çizgi ve esnek görselleştirme ayarları.
Nasıl Kullanılır
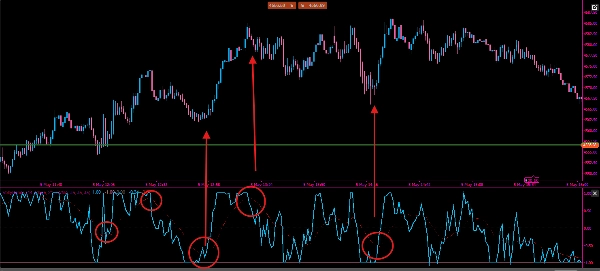
- Momentum Tespiti
Fiyatın üst banda yakın hareket etmesi yükseliş gücünü, alt banda yakın olması ise düşüş baskısını gösterebilir. - Dönüş Bölgeleri
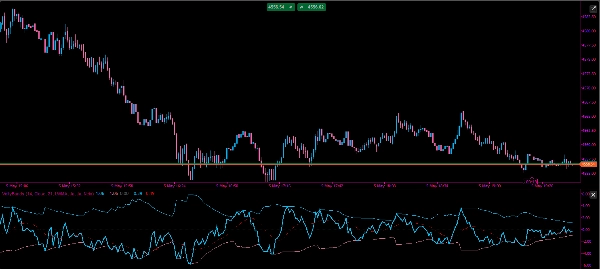
Merkez çizgisinden aşırı sapmalar, fiyatın geri dönebileceği alanları vurgulayabilir. - Volatilite Analizi
Genişleyen bantlar artan volatiliteyi, daralan bantlar ise konsolidasyonu gösterir. - Sinyal Onayı
Giriş veya çıkışlar için ek filtre olarak hareketli ortalamayı kullanın.
Parametreler
- Uzunluk – Volatilite hesaplamasının hassasiyetini tanımlar
- Kaynak – Girdi fiyatı (Kapanış, Açılış, vb.)
- HO Periyodu – Yumuşatma hattı için periyot
- HO Yöntemi – Hareketli ortalama türü (SMA, EMA, SMMA, LWMA)
- Orta Çizgiyi Göster – Merkez çizgisini açma/kapama
- Sıfır Bağlama – Sıfır tabanlı görselleştirmeyi etkinleştir
- Normalize Et – Normalleştirilmiş ölçeklendirmeyi etkinleştir
Pratik Kullanım
VoltyBands, momentumu ve piyasa yapısını gerçek zamanlı olarak değerlendirmek için kullanılabilir. Fiyat üst banda yakın kaldığında, sürekli yükseliş baskısı olduğu; alt bantla sürekli etkileşimde ise düşüş koşullarının bulunduğu anlaşılır.
Aralıklı piyasalarda, yatırımcılar fiyatın bantlar arasında hareket etmesini bekleyebilir ve dış seviyeleri ortalamaya dönüş için potansiyel alanlar olarak kullanabilir. Buna karşılık, güçlü trendlerde fiyat bantların bir tarafında “seyredebilir” ve bu durum dönüşten ziyade devam sinyali verir.
Orta çizgi dinamik bir denge seviyesi olarak hizmet edebilir. Bu çizginin üzerinde veya altında gerçekleşen kesişimler, özellikle yerleşik hareketli ortalama ile onaylandığında yön sinyali olarak kullanılabilir.
Normalize modda, değerler göreceli aşırılıklar olarak yorumlanabilir ve bu da enstrüman veya zaman diliminden bağımsız olarak aşırı genişlemiş koşulların tespitini kolaylaştırır.
Herhangi bir gösterge gibi, VoltyBands en iyi fiyat hareketi ve ek onay araçları ile birlikte kullanıldığında etkilidir.