
Reactive Moving Average
지표
260 다운로드
버전 1.0, Jan 2025
Windows, Mac
5.0
리뷰: 1
설명
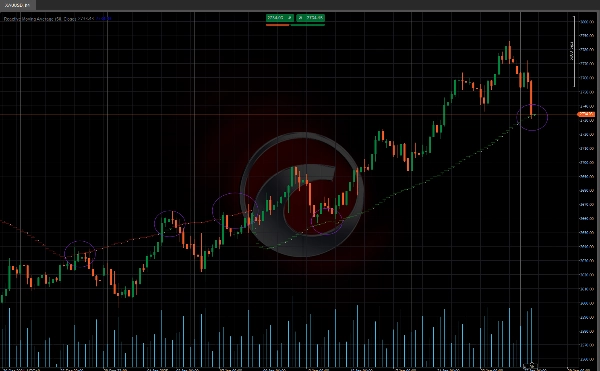
📈 시그널 이동평균 📉
이 시그널 이동평균 은 단순 이동평균(SMA)과 동적 상관관계 계산을 결합하여 시장 상황에 더 잘 적응하는 지표입니다. 🎯 이 지표는 추세의 강도에 따라 민감도를 조절하여 추세를 식별하고 시장 잡음을 걸러내는 강력한 도구입니다. 🌟
주요 특징 🔑
📊 조정된 이동평균:
- 이동평균선은 가격과 시간 간의 상관관계에 따라 동적으로 조정됩니다.
- 강한 추세 시장에서는 이동평균이 가격을 따라 더 빠르게 움직입니다. 🚀
- 횡보 시장에서는 이동평균이 더 안정적으로 유지되어 잘못된 신호를 줄입니다. 🛑
🔢 상관관계 계산:
- 이 지표는 피어슨 공식을 사용하여 가격과 시간 간의 상관관계를 계산합니다.
- 결정계수(R²)를 기반으로 이동평균을 조정합니다. 🧮
👀 시각화:
- 명확하고 직관적인 표시로 쉽게 해석할 수 있습니다. 📉📈
지표 사용 방법 🛠️
🔍 추세 식별:
- 강세 추세: 가격이 상관된 이동평균선 위에 있을 때. 🐂
- 약세 추세: 가격이 상관된 이동평균선 아래에 있을 때. 🐻
✅ 신호 확인:
- 조정된 이동평균을 동적 지지 또는 저항 수준으로 사용하세요. 🛡️
- 이 지표를 다른 기술 도구와 결합하여 신호를 확인하세요. 🔄
이동평균 조정 ⚙️
알고리즘은 R² 값에 따라 이동평균을 조정합니다:
- R² > 0.5인 경우 (유의미한 상관관계):
-
- 이동평균은 현재 SMA 값과 이전 조정 이동평균(_ma) 값을 가중 결합하여 조정됩니다.
- 가중치는 R² 값에 따라 결정됩니다. ⚖️
- R² ≤ 0.5인 경우 (유의미하지 않은 상관관계):
-
- 이동평균은 현재 SMA 값과 이전 조정 이동평균 값 간의 절대 차이에 비례하는 값을 빼서 조정됩니다. 🔄
- Ctrader 스토어 지표:
요약
지표 프로필
고객 리뷰
5.0
리뷰: 1
5 | 100 % | |
4 | 0 % | |
3 | 0 % | |
2 | 0 % | |
1 | 0 % |
고객 리뷰
August 12, 2025
Pros: Adaptive moving average combining SMA with dynamic correlation to reduce lag and smooth price noise. Flexible sensitivity settings. Cons: No alerts or tooltips. No template saving. Can produce noise on low-end PCs or very short timeframes.
상담
자주 묻는 질문(FAQ)
Signal
Breakout
Supertrend
RSI
트레이딩 봇, 지표, 플러그인 등 cTrader Store에서 제공되는 상품은 제3자 개발자에 의해 제공되며, 이는 단순히 정보 및 기술적 접근을 목적으로 제공된 것입니다. cTrader Store는 중개인이 아니며, 투자 조언, 개인별 추천 또는 향후 성과에 대한 어떠한 보장도 제공하지 않습니다.


가격
가입일 03/10/2024
163
판매
37.73K
무료 설치