Opis
Zestaw narzędzi wsparcia i oporu to kompleksowy wskaźnik analizy struktury rynku, zaprojektowany, aby pomóc traderom w identyfikacji stref wsparcia i oporu o wysokim prawdopodobieństwie na wykresach. Łącząc wiele zaawansowanych algorytmów wykrywania punktów zwrotnych z adaptacyjnymi strefami zmienności, filtrami przepływu pieniędzy instytucjonalnych oraz analizą płynności, ten zestaw narzędzi przekształca tradycyjne linie wsparcia i oporu w narzędzie strategiczne oparte na danych.
Wykrywanie
Ten zestaw narzędzi zawiera cztery zaawansowane metody wykrywania, zaprojektowane tak, aby pasowały do różnych stylów handlu i warunków rynkowych:
- Punkty zwrotne: Klasyczne podejście do wykrywania wsparcia i oporu, wykorzystujące konfigurowalne siły cofania w lewo i prawo do wykrywania lokalnych szczytów i dołków.
- Donchian: Wysokowydajny algorytm maszyny stanów, który wykrywa naprzemienne struktury wahadłowe. Zamiast używać stałego opóźnienia, potwierdza ekstremy, gdy rynek zmienia stan kierunkowy.
- CSID: Metoda wykrywania oparta na momentum, która identyfikuje strukturalne punkty zwrotne na podstawie kolejnych byczych lub niedźwiedzich świec, podkreślając silne strefy inicjacji trendu.
- ZigZag: Algorytm oparty na zmienności, który filtruje drobne wahania cen, wymagając minimalnego procentowego odchylenia przed zidentyfikowaniem wahadła.
Strefa / Poziom
W przeciwieństwie do konwencjonalnych wskaźników, które po prostu rysują stałe linie, to narzędzie traktuje poziomy wsparcia i oporu jako dynamiczne strefy cenowe oparte na następujących cechach:
- Głębokość strefy (wielokrotność ATR): Określa grubość każdej strefy na podstawie Średniego Rzeczywistego Zasięgu. Pozwala to strefom automatycznie skalować się wraz ze zmiennością rynku.
- Bufor wybicia (wielokrotność ATR): Unikalny bufor zabezpieczający, który rozszerza strefę poza stronę wybicia. Cena musi przesunąć się poza tę dodatkową warstwę zmienności, zanim wskaźnik potwierdzi wybicie, co redukuje fałszywe sygnały i fałszywe wybicia.
Filtrowanie i widoczność:
- Scalanie nakładających się stref: Łączy przecinające się strefy w większą „Super Strefę”, która reprezentuje pełen zakres historycznej interakcji.
- Ukryj najstarsze najpierw: Priorytetyzuje najnowszą strukturę rynku, ukrywając starsze strefy, gdy dochodzi do nakładania się.
- Ukryj najmłodsze najpierw: Zachowuje ustalone struktury historyczne, ignorując mniejsze nowe strefy pojawiające się w istniejących zakresach.
Filtrowanie poziomów (E: Wejścia | S: Siła | SW: Zamiatania | V: Wolumen | D: Czas trwania)
- Wejścia cenowe (E): Wymaga, aby poziom był testowany określoną liczbę razy, zanim pojawi się na wykresie.
- Zamiatania (SW): Wykrywa pułapki płynności, gdzie cena chwilowo narusza poziom knotem, ale zamyka się z powrotem wewnątrz strefy.
- Obrót wolumenem (V): Śledzi całkowity wolumen obrotu, który występuje podczas interakcji ceny ze strefą, podkreślając udział instytucjonalny.
- Czas trwania (D): Wymaga, aby strefy przetrwały minimalną liczbę świec, zanim zostaną uznane za ważne poziomy strukturalne.
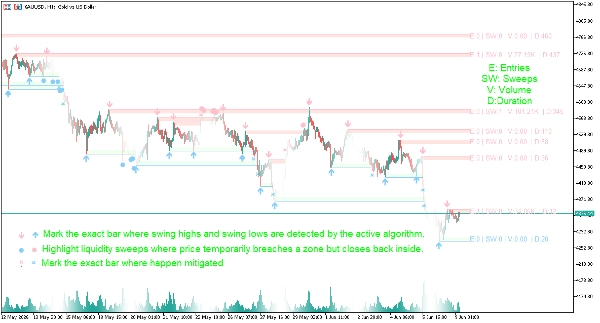
Sygnaly wizualne
- ⬆/⬇ Strzałki: Oznaczają dokładną świecę, na której aktywny algorytm wykrywa szczyty i dołki wahadłowe.
- ● Duże kropki: Podkreślają zamiatania płynności, gdzie cena tymczasowo narusza strefę, ale zamyka się z powrotem wewnątrz.
- ✖ Krzyż: Oznacza dokładną świecę, na której migrowane są szczyty i dołki wahadłowe.
- Etykiety podsumowujące: Każdy obszar wyświetlania zawiera zwięzłą etykietę danych, w tym parametry E (Wejścia), S (Siła), SW (Zamiatania), V (Wolumen) i D (Czas trwania), umożliwiając użytkownikom szybkie ocenienie jakości strukturalnej.
Panel sterowania
- Aktywne / Łączne: Wyświetla, ile struktur jest obecnie aktywnych w porównaniu z łączną liczbą wykrytą historycznie.
- Procent łagodzenia: Mierzy, jak często poziomy są przełamywane lub łagodzone, dostarczając wglądu w wiarygodność struktury rynku.
- Średni czas trwania: Średnia liczba świec, przez które strefa wsparcia lub oporu przetrwa, zanim zostanie przełamana.
- Średni wolumen: Wskazuje średni udział instytucjonalny w strefach przed wystąpieniem wybicia.
- Łączna liczba zamiatań: Śledzi zachowania polowania na płynność na rynku.
Ustawienia wskaźnika
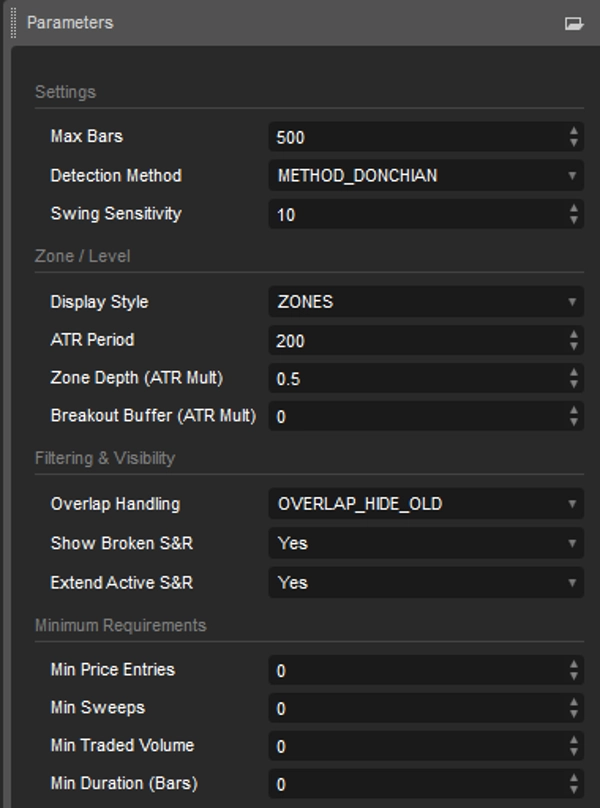
Ustawienia wykrywania
- Metoda wykrywania: Wybierz między logiką wykrywania wahadeł Pivots, Donchian, CSID lub ZigZag.
- Czułość wahadła: Dostosowuje wymaganą odchyłkę lub długość cofania potrzebną do potwierdzenia szczytów i dołków wahadłowych.
Konfiguracja stref i poziomów
- Styl wyświetlania: Przełączaj między precyzyjnymi poziomymi liniami wsparcia i oporu a strefami opartymi na ATR.
- Okres ATR: Określa okres zmienności używany do obliczeń stref.
- Głębokość strefy (wielokrotność ATR): Dostosowuje grubość stref wsparcia i oporu.
- Bufor wybicia (wielokrotność ATR): Dodaje bufor zmienności, aby odfiltrować fałszywe wybicia.
Widoczność wykresu i kontrola struktury
- Obsługa nakładania się: Wybierz, jak obsługiwane są nakładające się strefy (Scal, Ukryj najstarsze lub Ukryj najmłodsze).
- Maksymalna liczba aktywnych (nie złagodzonych): Ogranicza liczbę aktywnych stref wsparcia i oporu wyświetlanych na wykresie.
- Pokaż złamane wsparcie i opór: Przełącz, czy złamane poziomy pozostają widoczne do analizy historycznej.
- Przedłuż aktywne wsparcie i opór: Projekcja aktywnych poziomów na przyszłe świece cenowe.
Minimalne wymagania strukturalne
- Minimalna liczba wejść cenowych: Ustawia wymaganą liczbę ponownych testów, zanim poziom stanie się widoczny.
- Minimalna liczba zamiatań: Wymaga określonej liczby zamiatań płynności przed wyświetleniem strefy.
- Minimalny obrót wolumenem: Zapewnia, że strefy spełniają minimalny próg udziału instytucjonalnego.
- Minimalny czas trwania (świece): Wymaga, aby poziomy istniały przez określoną liczbę świec, zanim się pojawią.
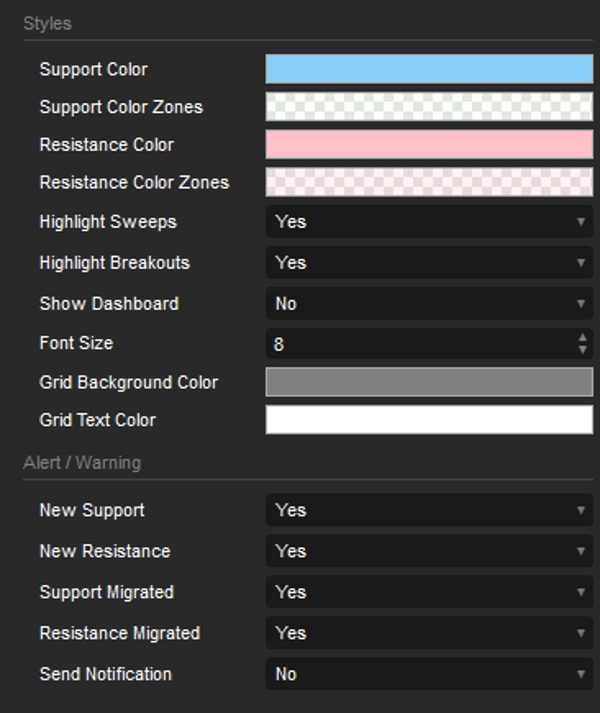
Style i alerty
- Style: Dostosuj konfigurację kolorów obiektów. Ukryj/Pokaż panel sterowania.
- Alert: Włącz/wyłącz alerty za każdym razem, gdy wykrywane jest nowe wsparcie lub opór albo gdy wsparcie lub opór jest migrowane.
Podsumowanie
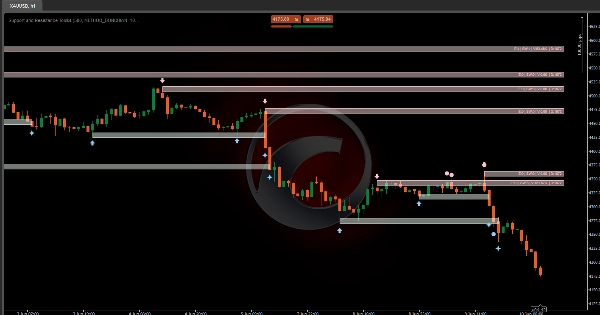
Unlike traditional fixed lines, this tool defines support and resistance as dynamic price zones, with thickness and breakout buffers scaled by Average True Range (ATR) to adapt to market volatility. It features zone merging and selective visibility options to manage overlapping zones, prioritizing recent or historical structures as needed.
The indicator applies multiple filters based on price re-tests, liquidity sweeps, traded volume, and zone duration to validate structural levels. Visual signals include arrows marking swing points, dots highlighting liquidity sweeps, crosses for migrated swings, and summary labels displaying entries, strength, sweeps, volume, and duration metrics.
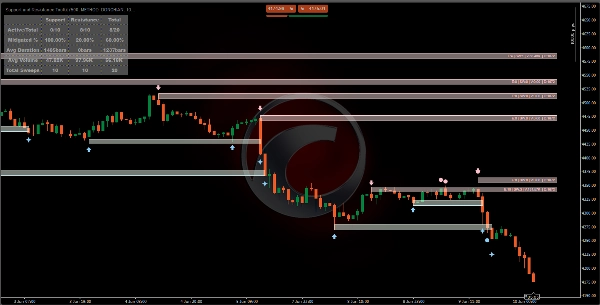
A dashboard provides real-time statistics on active versus total structures, mitigation percentages, average zone duration, volume, and liquidity sweep counts. Users can customize detection methods, sensitivity, zone display styles, ATR parameters, overlap handling, and structural requirements. Alerts can be enabled for new or migrated support and resistance levels.
This toolkit supports detailed market structure analysis with data-driven, volatility-adjusted zones to assist traders in identifying key price areas.