Opis
Przegląd wskaźnika
Wskaźnik Shadeesoflife DOL (Draw on Liquidity) c Trader dostarcza dynamiczny silnik identyfikacji celów oparty na koncepcjach Smart Money (SMC) i zasadach ICT. Automatycznie rysuje Linię na Płynności (DOL), klasyfikuje i śledzi strukturalne pule płynności - "Wysoka konfluencja" na rynku przy każdym tikcie. DOL to dynamiczny cel, wysoka konfluencja płynności.
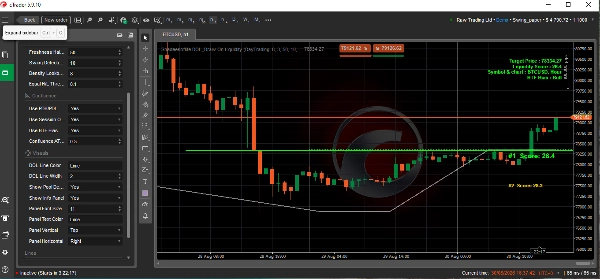
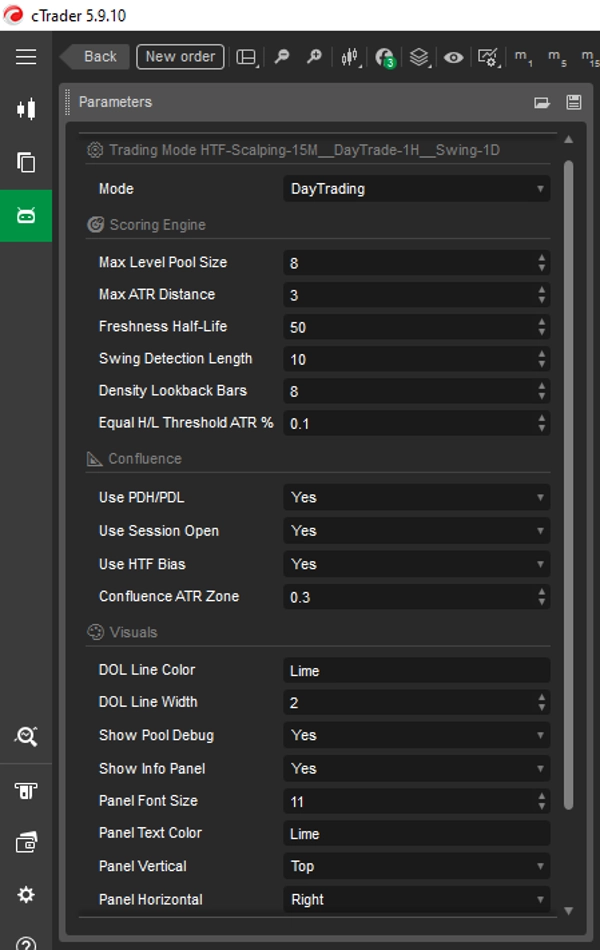
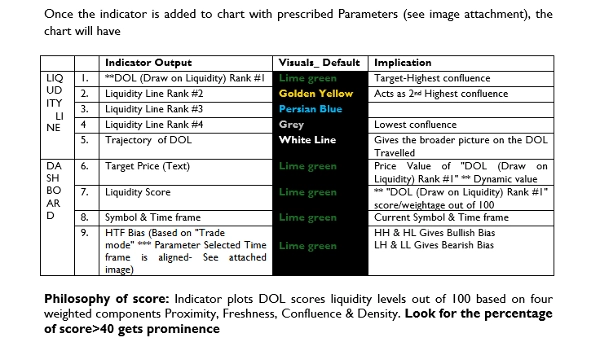
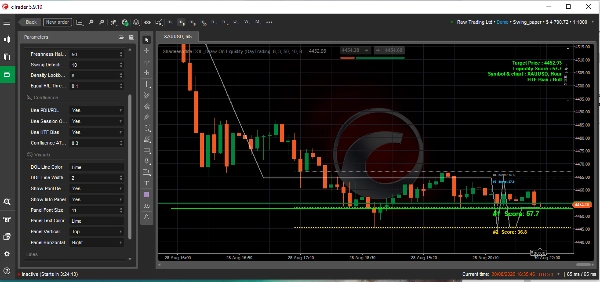
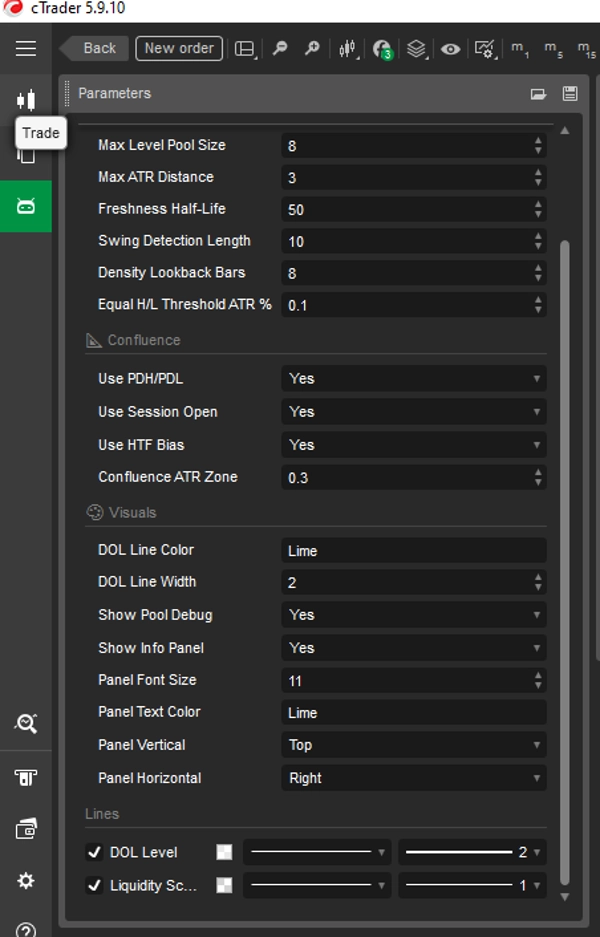
Wskaźnik wyświetla główny Cel DOL (poziom o najwyższej punktacji, pokazany jako wyraźna linia) wraz z uszeregowaną pulą wtórnych celów płynności, jednocześnie zapewniając panel na ekranie pokazujący aktualne nastawienie HTF i metryki celów. Po dodaniu wskaźnika do wykresu z zalecanymi Parametrami (patrz załączony obraz), wykres będzie miał
Aby uzyskać odpowiedź - zobacz załączony obraz (Tabela).
Filozofia punktacji: Wskaźnik rysuje punkty DOL poziomów płynności w skali 0-100 na podstawie czterech ważonych składników Bliskość, Świeżość, Konfluencja i Gęstość.
Najczęściej zadawane pytania
1.Jak to działa - ramy strategii wieloczasowej HTF i LTF??
Identyfikacja nastawienia i kierunku wyższego interwału czasowego (HTF)
Wskaźnik określa strukturalne nastawienie, wykorzystując wybrany tryb handlu (Trading Mode) do odniesienia się do wyższego interwału czasowego (np.***Dzienny dla Swing, 1-godzinny dla Day Trading, 15-minutowy dla Scalping):
- Bycze nastawienie HTF:
- Warunek: Świeca HTF zamyka się powyżej otwarcia (HTF Bycze).
- Zachowanie wskaźnika: Silnik punktacji pokazuje, że cena celu (#1 oznaczona linia) jest oznaczona poniżej ceny Ask/bid (cel HTF pokazuje wewnętrzną płynność, a cena celu LTF pokazuje zewnętrzną płynność).
- Implikacje handlowe: Cena szuka płynności po stronie sprzedaży (SSL) poniżej dla zniżkowego cofnięcia przed kontynuacją w górę, lub celuje w płynność po stronie kupna (BSL) powyżej jako ostateczny cel ekspansji.
- Niedźwiedzie nastawienie HTF:
- Warunek: Świeca HTF zamyka się poniżej otwarcia (HTF Niedźwiedź).
- Zachowanie wskaźnika: Silnik punktacji pokazuje, że cena celu (#1 oznaczona linia) jest oznaczona powyżej ceny Ask/bid (cel HTF pokazuje wewnętrzną płynność, a cena celu LTF pokazuje zewnętrzną płynność).
- Implikacje handlowe: Cena szuka płynności po stronie kupna (BSL) powyżej dla premiowego cofnięcia przed ruchem w dół, lub celuje w płynność po stronie sprzedaży (SSL) poniżej.
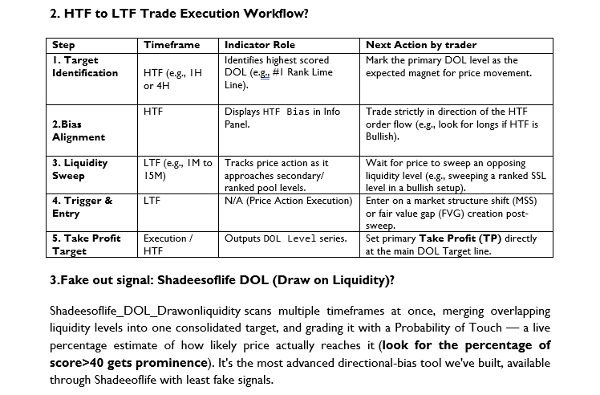
2. Przepływ wykonania transakcji od HTF do LTF?
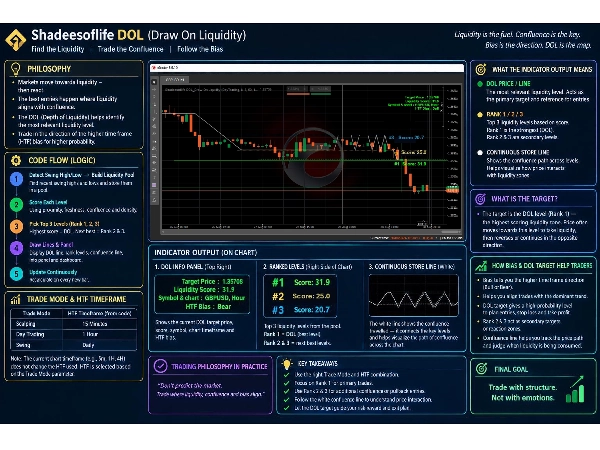
Aby uzyskać odpowiedź - zobacz załączony obraz (Tabela).
3.Sygnal fałszywy: Shadeesoflife DOL (Draw on Liquidity)?
"Shadeesoflife DOL Draw on liquidity" skanuje wiele interwałów czasowych jednocześnie, łącząc nakładające się poziomy płynności w jeden skonsolidowany cel i oceniając go za pomocą Prawdopodobieństwa Dotknięcia — na żywo procentowego oszacowania, jak prawdopodobne jest, że cena faktycznie go osiągnie (szukaj procentu punktacji>40, który zyskuje na znaczeniu). To najbardziej zaawansowane narzędzie do określania kierunku, jakie stworzyliśmy, dostępne przez Shadeeoflife z najmniejszą liczbą fałszywych sygnałów.
4. Jak działa konfluencja w technicznym "Shadeesoflife DOL Draw on liquidity"?
"Shadeesoflife DOL Draw on liquidity" skanuje płynność wewnętrzną, zewnętrzną, bloki zleceń, bloki przełamania, FVG, iFVG oraz BSL/SSL dla swojego nastawienia kierunkowego. DOL Pro działa na zupełnie innym silniku — skanuje EQH/EQL, duże FVG, granice sesji, PDH/PDL oraz luki nocne/weekendowe w wielu interwałach czasowych, odczytuje nastawienie sesji jak ruchy Judasza i kontynuacje, i ocenia swój cel za pomocą na żywo Prawdopodobieństwa Dotknięcia, z dużo inteligentniejszymi algorytmami. Ta sama misja określania kierunku co DOL, zbudowana na bardziej rygorystycznym silniku. Dostarcza wynik wysokoprawdopodobnego setupu, zapewniając Kierunek i Wyższy cel konfluencji cenowej.
Odczytuje wiele interwałów czasowych jednocześnie, nie tylko jeden, Skanuje EQH/EQL, duże FVG, granice sesji, PDH/PDL oraz luki nocne/weekendowe. Odczytuje nastawienie sesji — wzorce takie jak ruchy Judasza i kontynuacje.
┌──────────────────────────────────────┐
│ KONCEPCJE ICT / PŁYNNOŚCI │
│ DOL • PDH • PDL • Sesja • HTF │
│ Płynność • Równe maksimum/minimum │
└──────────────────┬───────────────────┘
↓
┌──────────────────────────────────────┐
│ WARSTWA SMC / STRUKTURY │
│ Swing High • Swing Low │
│ Pule płynności • Kierunek HTF │
└──────────────────┬───────────────────┘
↓
┌─────────────────────────────────────────┐
│ SILNIK KWANTOWY SHADEESOFLIFE │
│ Bliskość X% + Świeżość Y% + Konfluencja Z% + Gęstość A% │
│ │
│ → 0–100 Punktacja → Ranking #1/#2/#3 → Dynamiczny DOL │
└─────────────────────────────────────────┘
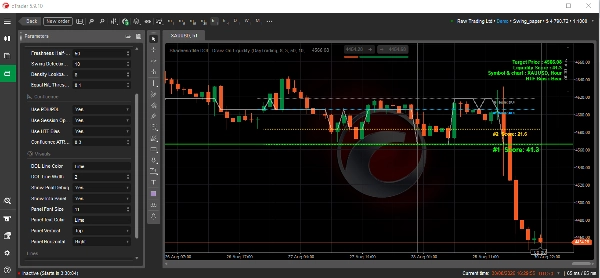
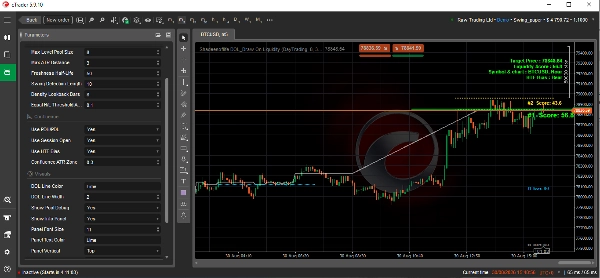
📊Techniczna analiza wykresu (interpretacja załączonego obrazu)
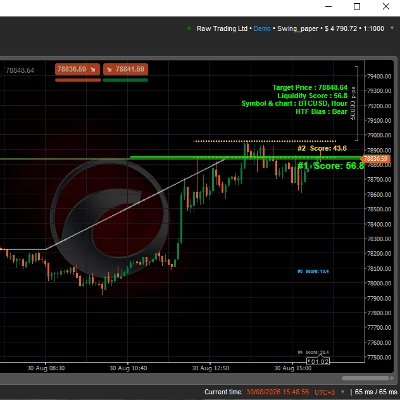
Ten wykres z platformy handlowej cTrader przedstawia BTCUSD (Bitcoin / Dolar amerykański) na horyzoncie czasowym 5 minut (m5). Zawiera niestandardowy automatyczny wskaźnik struktury rynku o nazwie "Shadeesoflife DOL Draw On Liquidity", który jest skonfigurowany za pomocą koncepcji Smart Money (SMC).
🔎 Kluczowe metryki techniczne i analiza
- Aktualna cena: Aktywo jest notowane na poziomie 78 856,48, poruszając się ściśle w bardzo wąskim, wysokopłynnym zakresie.
- Cena celu / Draw on Liquidity (DOL): Oznaczona przez solidną jasną zieloną linię poziomą na 78 848,64. Służy jako wyraźny magnes dla ruchu cenowego.
- Wynik płynności (57,3): Umiarkowany wynik wskazujący stabilne, ale nie przytłaczające zlecenia instytucjonalne wokół tej strefy.
- Nastawienie wyższego interwału czasowego (HTF): Wyraźnie oznaczone jako Niedźwiedzie (Bear). System oczekuje kontynuacji spadkowej po oczyszczeniu płynności kupna.
- Algorytmiczne priorytety punktacji:
- #1 Wynik (57,3): Znajduje się bezpośrednio na zielonej linii celu.
- #2 Wynik (45,8): Odpoczywa nieco wyżej na czerwonym poziomie bazowym.
💡 Podstawowa interpretacja strategiczna
Wskaźnik mapuje klasyczny setup SMC, gdzie silnik rynku dąży do zamiatania określonych instytucjonalnych pul.
- Efekt magnesu: Cena przesunęła się w górę do strefy premium i teraz silnie przyciąga się do zielonej linii bazowej Draw on Liquidity (DOL) na poziomie 78 848,64.
- Dopasowanie trendu: Ponieważ strukturalne nastawienie HTF jest Niedźwiedzie, lokalne przesunięcie w dół w kierunku linii DOL idealnie współgra z dominującym trendem.
- Oczyszczenie płynności: Po osiągnięciu i zneutralizowaniu płynności spoczynkowej na tej zielonej linii, traderzy zazwyczaj oczekują zdecydowanego przełamania strukturalnego lub agresywnej kontynuacji makro kierunku niedźwiedziego.
Uwaga:
- Może być używany na BTCUSD, XAUUSD, GBPUSD lub dowolnym symbolu.
- Powyższa analiza BTCUSD opiera się na wykresie LTF 5m (ręczny wybór wykresu) i HTF 1DAY (parametr “Tryb handlu” ustawiony na Day trade z rozwijanego menu).
- Wskaźnik może być używany dla (parametr “Tryb handlu” dopasowuje się do interwału czasowego dla BIAS)
- Scalping - HTF 15M, (domyślnie)
- Day trade - HTF 1H,
- Swing trade - HTF 1D,
- Handel czterogodzinny - HTF 4H
- Parametr "Pokaż debugowanie puli" może być użyty do wyłączenia mniej ważnej linii konfluencji celu poza linią z rankingiem #1.
- Parametr "Pokaż panel informacyjny" może być użyty do wyłączenia i ukrycia panelu.
- Panel może być dostosowany pod względem rozmiaru tekstu, koloru tekstu i pozycji panelu (pozycja pozioma/pionowa).
- Pozycja linii "Poziom DOL" na osi X (Cena) wskazuje linię konfluencji celu z rankingiem #1 na odpowiedniej osi Y (Czas).
Podsumowanie
The indicator outputs a primary Draw on Liquidity (DOL) target line representing the highest-scored liquidity level, along with secondary ranked targets. It provides an on-screen panel displaying higher timeframe (HTF) bias and target metrics, supporting trading styles from scalping to swing trading by referencing appropriate HTFs (e.g., 15-minute for scalping, daily for swing).
Shadeesoflife DOL integrates multi-timeframe analysis, scanning equal highs/lows, fair value gaps, session boundaries, previous day highs/lows, and gaps to assess directional bias and price magnet levels. It calculates a live Probability of Touch (PoT) percentage estimating the likelihood of price reaching each target.
Traders use the indicator to align trades with HTF bias, identify liquidity sweeps on lower timeframes, and set entries and take profit targets at ranked liquidity pools. It supports markets including BTCUSD and XAUUSD and offers customizable display options for target lines and info panels.