
Descrizione
Market Data & Conditions Analyzed
The Quantum Crypto Strength Lite Indicator is an intuitive market analysis tool designed to cut through the complexities of crypto markets. Unlike traditional forex markets where individual currencies can be cleanly isolated, cryptocurrencies naturally move en masse—typically moving up or down together in broad market waves.
The indicator isolates individual cryptocurrency strength by calculating its price action directly against Tether (USDT), which acts as a proxy for the US Dollar. It continuously tracks and displays the relative trend strength, speed, and overbought/oversold momentum of three distinct cryptocurrencies simultaneously on a single chart panel. These are Bitcoin, Ethereum, and Solaris.
Visual Elements & Signal Interpretation
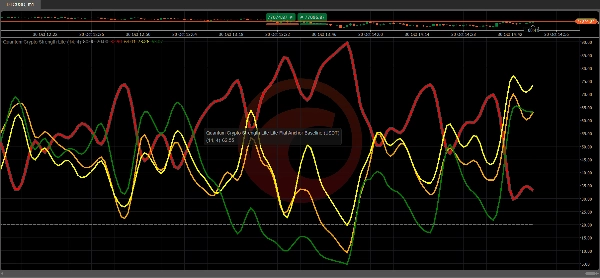
The indicator transforms complex multi-asset data into a clean, easy-to-read visual dashboard that can act as your radar on the market:
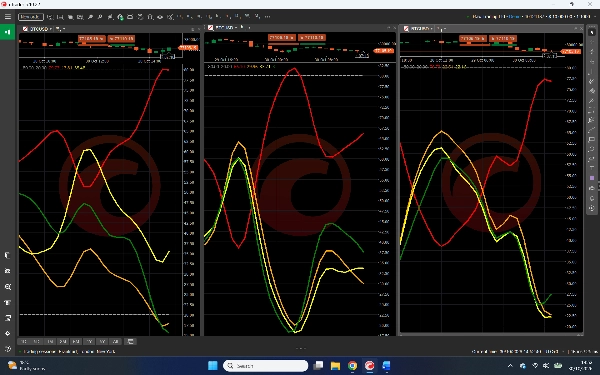
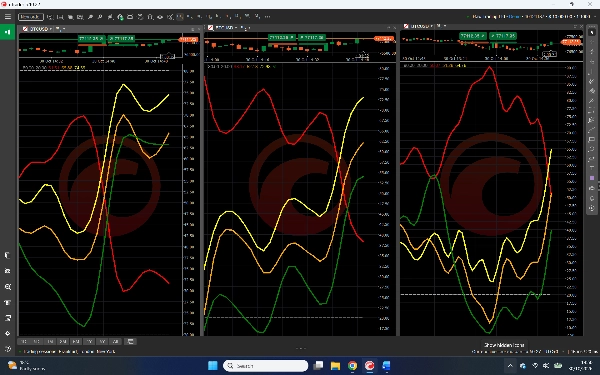
- The Instrument Lines: Each cryptocurrency is displayed as an individual colored line, plotted dynamically on a scale ranging from 0 to 100.
- The Counter-Currency Line (USDT): Plotted as a separate prominent line (typically red), allowing you to gauge the opposing force and capital flow directly.
- Strong Uptrends: Confirmed visually when a cryptocurrency line rises strongly while the USDT line falls with matching velocity.
- Strong Downtrends: Confirmed when a cryptocurrency line falls sharply while the USDT line moves aggressively higher.
- Overbought / Oversold Zones: Horizontal thresholds are fixed at 80 (Overbought) and 20 (Oversold). When a crypto line enters these zones, it signals that a trend is approaching extremes and a potential turning point or reversal is possible.
- Market Congestion: When multiple cryptocurrency lines bunch together horizontally, it signals a consolidation or pause phase—often seen right before a major market breakout.
Key Settings & Parameters
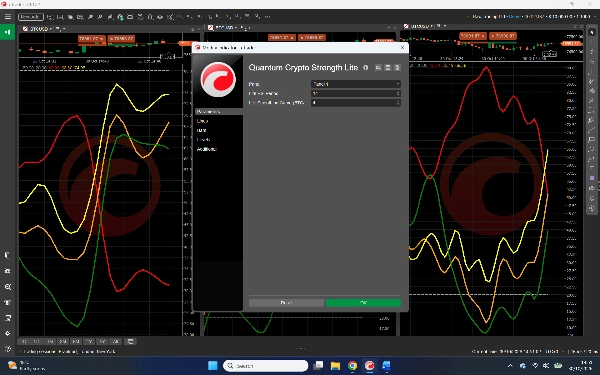
- Cryptocurrency Slots: The indicator offers three of the most heavily traded cryptocurrencies namely BTCUSD, ETHUSD and finally SOLUSD. These are fixed and cannot be changed by the user.
- Lookback Period: Adjusts the number of bars used to calculate the relative strength matrix, allowing you to fine-tune the indicator's responsiveness to short-term scalping or long-term trends.
- Overbought/Oversold Thresholds: Customizable trigger lines (default 80 and 20) to match your risk tolerance.
- The indicator works in all timeframes, from the fastest for scalping to the slowest for swing or trend trading.
Typical Use Cases & Trading Scenarios
- Spotting Broad Reversals: The indicator helps to identify potential market tops and bottoms by monitoring assets migrating from a potential overbought boundary (e.g., above 80) or lower, or equally a potentially oversold region below 20. Remember that cryptocurrencies like forex pairs can stay overbought or oversold for long periods.
- Breakout Trading: Monitoring low-volatility congestion phases where lines are tightly woven together, preparing to enter a possible trade as the lines move against Tether and break away in opposite directions.
- Position Monitoring: Managing active trades by monitoring how the cryptos are moving against USDT, from where on the indicator and with any momentum
Target Audience & Trader Profile
- Experience Level: While the visual layout is highly intuitive, a fundamental understanding of multi-timeframe analysis and crypto market dynamics is required to maximize its efficiency.
- Trading Style: Because it works across all cTrader timeframes, it serves as a foundational "radar system" for anyone actively trading the crypto sector.
Important Usage Notes
- Not a Direct Trigger: The 80 and 20 lines are momentum boundaries, not automatic buy or sell signals. An asset can remain in an overbought or oversold state for extended periods during strong macro trends.
- Confirmation Required: The CCSI is a strength and confirmation radar. For optimal performance, it should always be used alongside your existing trading plan, volume and price action analysis, or structural support and resistance levels.
- Multiple Timeframes: The indicator should always be used in multiple timeframes as shown in the gallery of images. This then reveals trends or reversals as they happen in the faster timeframes and ultimately ripple through to your slower timeframes further downstream.
Track relative momentum, spot market reversals, & isolate trend strength for three major cryptocurrencies simultaneously.
Riepilogo
Key features include fixed cryptocurrency slots (BTCUSD, ETHUSD, SOLUSD), customizable lookback periods for trend responsiveness, and adjustable overbought/oversold thresholds (default 80 and 20). It supports all timeframes, from scalping to swing trading. The indicator aids in spotting potential market reversals, breakout opportunities, and monitoring active positions by analyzing momentum and relative strength dynamics.
Intended for traders with a fundamental understanding of crypto market behavior and multi-timeframe analysis, it serves as a confirmation tool rather than a direct buy/sell signal generator. Users are advised to combine its insights with other technical analysis methods such as volume, price action, and support/resistance levels for optimal decision-making.