Description
Overview
This strategy combines two popular technical indicators to identify high‑probability trading opportunities:
- Bollinger Bands are used to detect price extremes and potential reversal zones. Trades are opened when the price touches the upper or lower band.
- Relative Strength Index (RSI) filters these signals by measuring market momentum. Long trades are only taken when RSI is in the oversold zone, and short trades are taken when RSI is overbought.
By combining trend and momentum analysis, the robot aims to improve entry timing and reduce false signals.
Key Settings
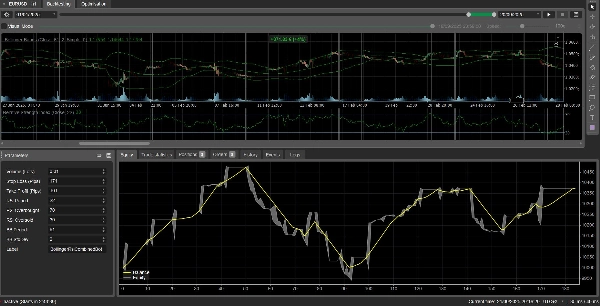
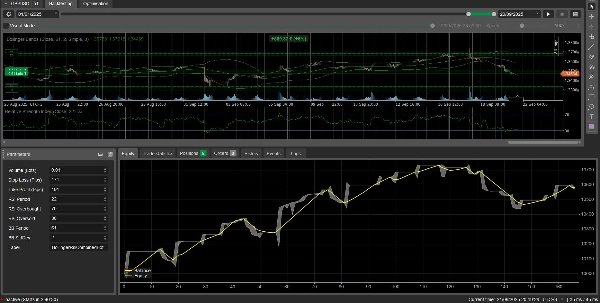
All parameters are fully customisable in the cBot’s configuration pane:
- Volume (lots) – position size. Default: 0.01 lots.
- Stop Loss / Take Profit (pips) – initial risk and reward levels. Defaults: 15 pips SL and 30 pips TP.
- RSI Period – calculation period for the RSI (default: 14).
- RSI Overbought / Oversold levels – thresholds that trigger short/long setups (defaults: 70 and 30).
- Bollinger Period – number of bars used to calculate the bands (default: 20).
- Bollinger Standard Deviation – band width (default: 2.0).
You can adjust these inputs to suit different symbols and timeframes.
Important Note
This is a simple, experimental strategy designed to demonstrate how multiple indicators can be combined in a cBot. It is not intended as financial advice and does not guarantee profits; use at your own risk and always test on a demo account before going live.
Backtest Highlights
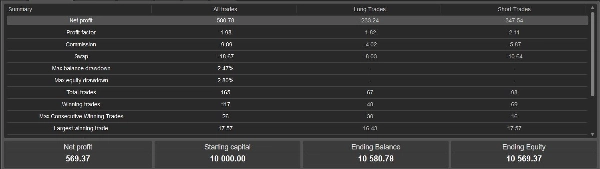
During a recent test on historical EURUSD data (H1 timeframe) with the default settings, the bot produced the following results (see attached screenshot):
- Net profit: $580.78 (starting balance $10,000)
- Profit factor: 1.98
- Total trades: 165, of which 117 were winners
- Max balance drawdown: 2.47 %
- Largest winning trade: $17.57
- Final equity: $10,569.37
These figures are for illustrative purposes only; past performance does not guarantee future results.
Summary
Key customizable settings include position volume, stop loss and take profit levels, RSI calculation period and threshold levels, as well as Bollinger Bands’ period and standard deviation. These parameters can be adjusted to fit different symbols and timeframes.
Backtesting on EURUSD (H1 timeframe) with default settings showed a net profit of $580.78 from a $10,000 starting balance, a profit factor of 1.98, and a maximum drawdown of 2.47%. The bot executed 165 trades, with 117 winners.
This strategy serves as a simple, experimental example of combining multiple indicators in automated trading. It is intended for demonstration purposes and should be tested on demo accounts before live use.