
Ichimocku Histogram and Candles - Muravha
Indicator
Version 1.0, Aug 2026
Windows, Mac

4.14M
Traded volume
38.59K
Pips won
1
Sales
Description
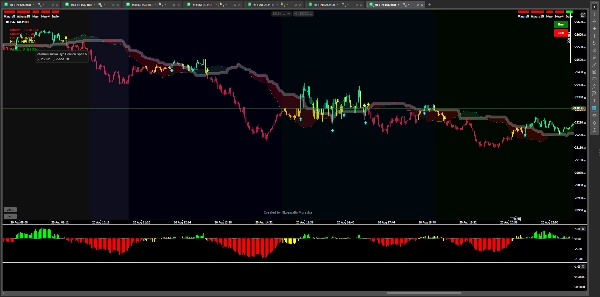
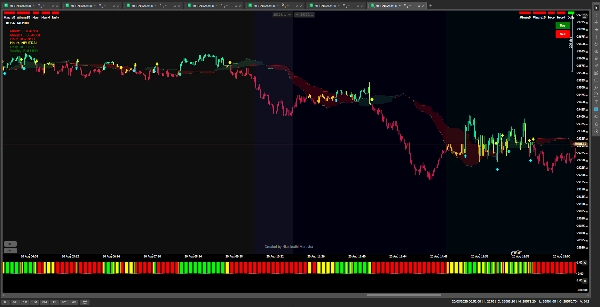
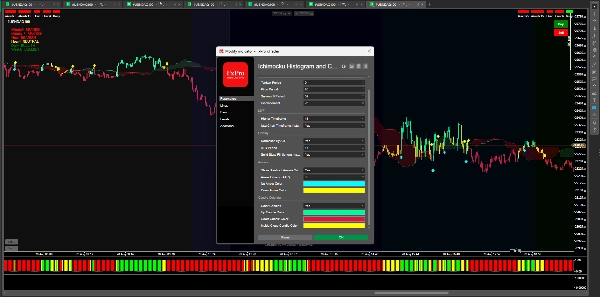
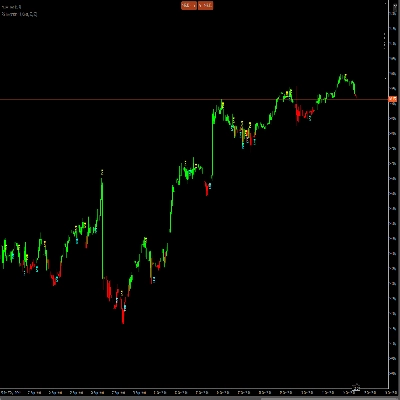
Based on the indicator name “Ichimocku Histogram and Candles”, its purpose is essentially to combine Ichimoku-style trend analysis with histogram/candle visualisation:
- Trend direction: Helps identify whether the market is bullish or bearish.
- Momentum: The histogram shows whether bullish or bearish momentum is strengthening or weakening.
- Candle signals: Color/appearance changes can make potential momentum shifts easier to see.
- Trade opportunities: Traders can look for momentum changes, trend continuation, and potential reversals, ideally confirmed with price action and higher-timeframe structure.
- Filtering trades: Rather than taking every signal, the indicator can help traders focus on setups where trend + momentum agree.
In simple terms: it is designed to make the market's trend and momentum easier to read visually, helping traders identify potential entry and exit areas.
Summary
AI summary
Ichimocku Histogram and Candles - Muravha is a trading indicator that integrates Ichimoku-style trend analysis with histogram and candle visualizations. It provides a visual representation of market trend direction, indicating whether the market is bullish or bearish. The histogram component displays momentum strength, showing whether bullish or bearish momentum is increasing or decreasing. Candle color and appearance changes highlight potential momentum shifts, making it easier to identify trade signals. The indicator helps traders spot potential buy and sell opportunities by signaling momentum changes, trend continuation, and possible reversals. It also assists in filtering trades by focusing on setups where trend and momentum align, supporting more informed decision-making. This tool is designed to simplify reading market trends and momentum visually, aiding traders in identifying potential entry and exit points. It supports analysis based on price action and higher-timeframe structure confirmation. The indicator outputs include filters, signals, and visualizations, and it supports signal types such as breakouts, trend strength, volatility regimes, level breaks, and reversals. It requires bar and volume data for operation.
Indicator profile
Indicator category
Momentum
Output type
Filter
Signals
Visualisation
Data requirements
Bars only
Volume
Supported signals
Breakout
Trend strength
Volatility
Level break
Reversal
Customer reviews
0.0
Reviews: 0
Customer reviews
No reviews for this product yet. Already tried it? Be the first to tell others!
Discussion
FAQ
Ichimoku
Products available through cTrader Store, including trading bots, indicators and plugins, are provided by third-party developers and made available for informational and technical access purposes only. cTrader Store is not a broker and does not provide investment advice, personal recommendations or any guarantee of future performance.
More from this author











Price
4.14M
Traded volume
38.59K
Pips won
1
Sales