Description
QuantumFlow — Advanced Order Flow & Volume Analytics
QuantumFlow is a high-precision order flow indicator designed for cTrader. It translates tick-by-tick market activity into dynamic volume clusters and automatically highlights institutional market footprint in real time.
Market Data & Analyzed Conditions
- Tick Volume & Delta: Analyzes raw tick distribution to separate buy and sell aggression per price level.
- Dynamic Range Aggregation: Groups ticks into adaptive clusters based on market volatility (ATR) rather than static bar counts.
- Session Boundaries: Continuously tracks daily high/low relative ranges to measure volume significance.
Visual Elements & Signal Interpretation
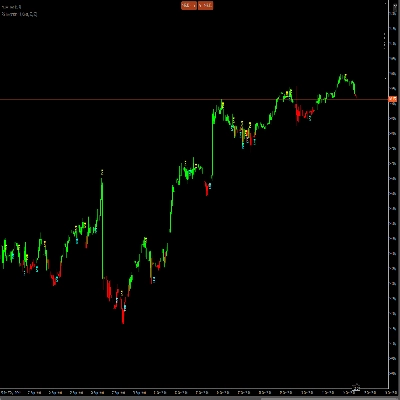
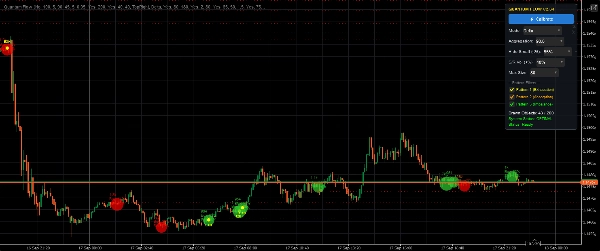
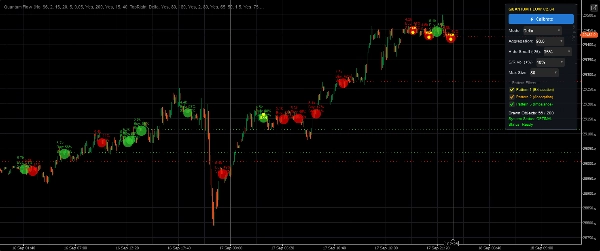
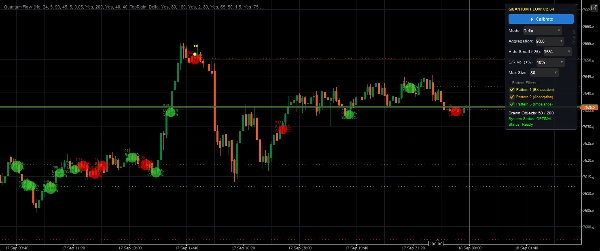
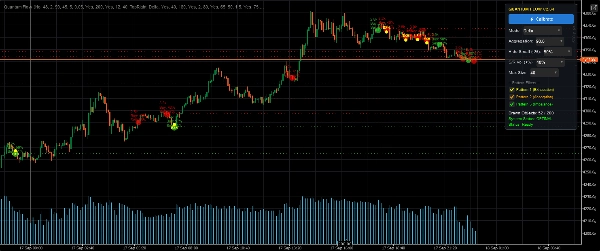
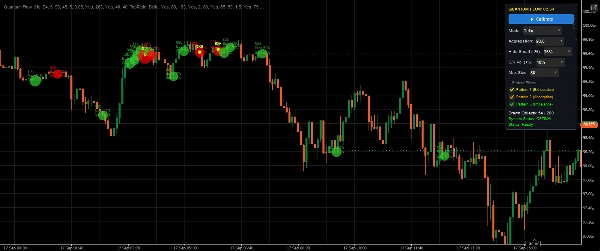
- Volume Bubbles (Visual Clusters): Bubble size scales with total volume. Green nodes indicate net buying pressure; red nodes indicate net selling pressure.
- Yellow Dot (Exhaustion): Marks extreme volume surge near daily highs/lows with weak follow-through—signaling market fatigue or potential reversal.
- Orange/Cyan Dot (Trapped Traders): Highlights heavy volume absorption at extremes (e.g., strong buying that fails to push price higher, trapping aggressive buyers).
- Lime/Magenta Dot (Imbalance): Detects aggressive directional initiative where one side dominates the delta with high volume velocity.
- Volume S/R Lines: Dotted horizontal lines automatically drawn at high-volume nodes, acting as key support and resistance zones.
Key Settings & Calibration
- Auto-Calibration: One-click algorithm that dynamically recalculates thresholds (aggregation, volume filters, pattern sensitivities) based on live ATR and history.
- Aggregation Sensitivity: Controls how tightly price ticks are grouped into visual clusters.
- Pattern Filters: Custom volume thresholds (
ExhMinVolFilter,TrappedMinVolume,ImbalanceMinVolume) to filter out noise during low-liquidity hours. - Performance Protection: Built-in auto-throttle limits active chart objects to prevent platform lag during high-volatility events.
Typical Use Cases & Trading Scenarios
- Breakout Validation: Confirm breakouts by looking for strong Imbalance signals in the direction of the move.
- Fade & Reversal Trading: Spot institutional exhaustion at daily highs or lows (Exhaustion dots) for quick mean-reversion entries.
- Liquidity Sweeps: Trade against trapped market participants (Trapped Traders signals) when price sweeps major levels and gets rejected.
Target Audience & Experience Level
- Trader Profile: Ideal for Day Traders, Scalpers, and Order Flow/Footprint enthusiasts.
- Skill Level: Best suited for Intermediate to Advanced traders familiar with volume delta, liquidity absorption, and market structure dynamics.
Important Usage Notes & Limitations
⚠️ Data Requirement: QuantumFlow relies on accurate tick volume data provided by your cTrader broker. Performance depends on high-quality tick feeds.
💡 Best Practice: Avoid using order flow signals in isolation. Always combine QuantumFlow visual patterns with higher-timeframe market structure and key support/resistance levels.
Summary
Visual elements include volume bubbles scaled by total volume with color-coded buying or selling pressure, and various signal dots indicating market conditions such as exhaustion near daily extremes, trapped traders at volume absorption points, and aggressive directional imbalances. It also automatically draws volume-based support and resistance lines at key price levels.
QuantumOrderFlow features one-click auto-calibration that adjusts thresholds dynamically using live ATR and historical data. Users can customize aggregation sensitivity and pattern filters to reduce noise during low liquidity periods. Performance protection limits chart objects to maintain platform responsiveness during volatile market events.
Typical applications include breakout validation, reversal trading by spotting institutional exhaustion, and trading liquidity sweeps against trapped participants. The indicator is designed for intermediate to advanced day traders and scalpers familiar with volume delta, liquidity absorption, and market structure concepts. It requires accurate tick volume data from the broker for optimal performance and is intended to be used alongside higher timeframe market structure analysis.