Description
ADR High & Low Lines
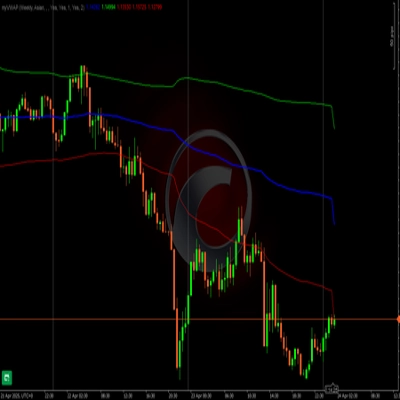
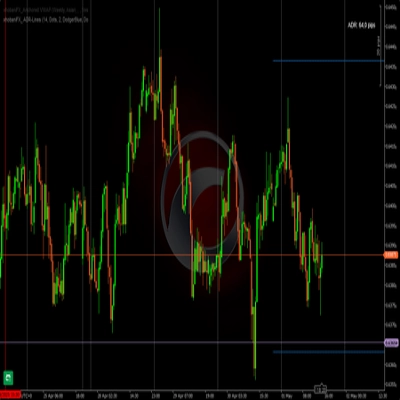
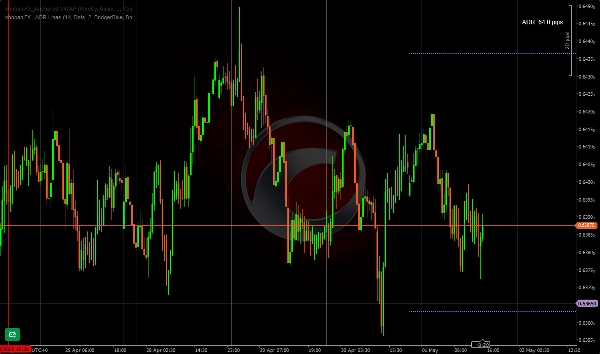
This ADR indicator plots horizontal lines for the current day's low/high based on the period the trader prefers. I like and use 14 days as a baseline period. It most suitable for scalpers/intraday traders. So you can easily notice when a high/low has been reached, you can choose the color/style/width of the lines to change to a different color of your choice once hit.
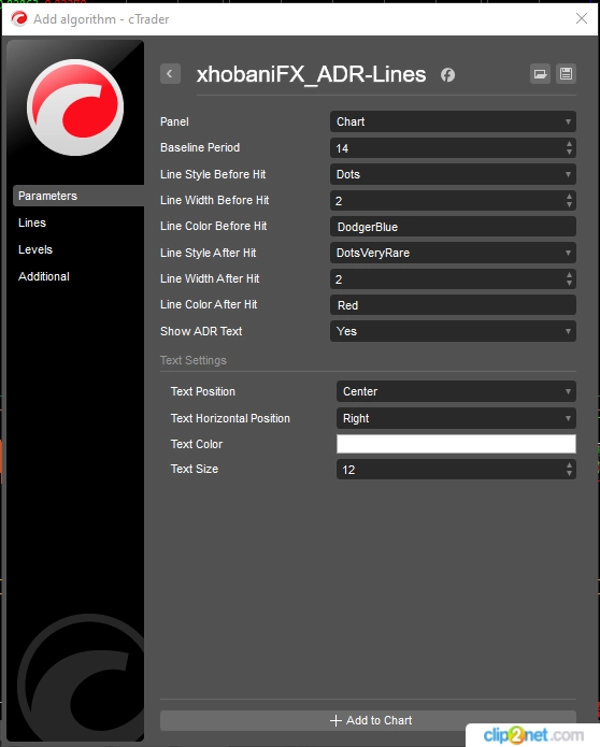
This indicator is developed in such a way that you can customize most of its parameters to suit your preferences and align with your workspace and colors.
Happy trading!
xhobani_FX
Summary
AI summary
xhobaniFX_ADR-Lines is an Average Daily Range (ADR) indicator designed for scalpers and intraday traders. It plots horizontal lines representing the current day's high and low levels based on a user-defined period, with 14 days commonly used as a baseline. The indicator visually highlights when these high or low levels are reached by allowing customization of line color, style, and width to change upon being hit. Most parameters are adjustable to fit individual trading preferences and workspace aesthetics. This tool aids traders in quickly identifying key price levels within the trading day.
Indicator profile
Customer reviews
4.0
Reviews: 2
5 | 0 % | |
4 | 100 % | |
3 | 0 % | |
2 | 0 % | |
1 | 0 % |
Discussion
FAQ
Products available through cTrader Store, including trading bots, indicators and plugins, are provided by third-party developers and made available for informational and technical access purposes only. cTrader Store is not a broker and does not provide investment advice, personal recommendations or any guarantee of future performance.