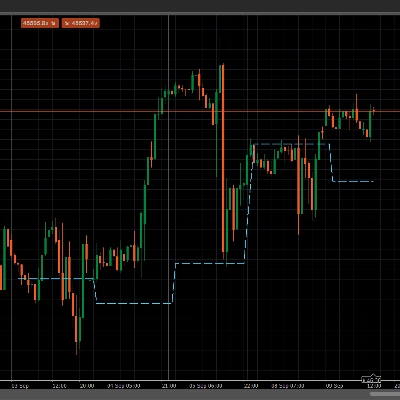
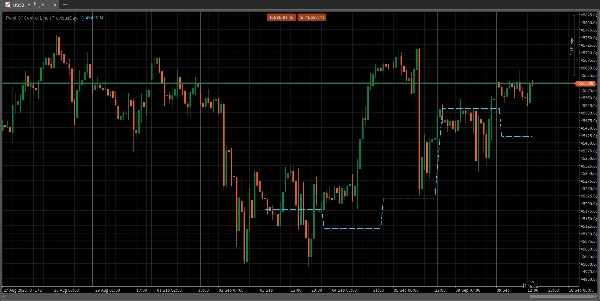
Logótipo de "POC session line_noSourceCode"
POC session line_noSourceCode
Imagem carregada de "POC session line_noSourceCode"
Desde 21/04/2025

The Point of Control (POC) is a price level on a volume profile chart where the most trading volume has been conducted within a specified period. This level acts as a significant support or resistance zone because it represents a price where large trading institutions were most active and where market price found consensus. Traders use the POC to identify key price zones, gauge market sentiment, and anticipate potential price movements and reversals

Indicator profile
0.0
Avaliações: 0
Avaliações de clientes
Ainda não há avaliações para este produto. Já o experimentou? Seja o primeiro a contar a outras pessoas!
Forex
Indices
Products available through cTrader Store, including trading bots, indicators and plugins, are provided by third-party developers and made available for informational and technical access purposes only. cTrader Store is not a broker and does not provide investment advice, personal recommendations or any guarantee of future performance.

Mais deste autor

Displays the POC line for previous sessions in an easy to see manner.

Também poderá gostar de

OHLC PRO – Advanced Session & Market Structure Tool
Very handy tool for traders looking to visualize previous days premium and discount price levels.
Designed to identify and visualize price reversal patterns using Bézier curves.
ADXR, KDJ, SineWave, Bollinger Band Volatility and AEOscillator.
Performance Panel von BullMoon Finance: Analysiere Deine cTrader-Historie visuell direkt im Chart!
volumen perfile
Multi-anchor VWAP indicator for cTrader. Plots two VWAP lines (red and blue) with selectable anchors.
SmartZig — Dual Market Structure ZigZag: Clean Body-Based Pivots, Invisible Chart Mode & Draggable Timeframe Inspection
VWAP (Volume Weighted Average Price, Precio Promedio Ponderado por Volumen)
Anchor-based Fibonacci channel that grows with the market. Seven display modes, auto-direction, fully draggable.
this indicaotr show distance between Tenkan to Kijun, Close to Kijun and Close to Tenkan 
Logótipo de "PMAX"
5.0
(6)
Grátis
It's a combination of two trailing stop loss and the other one is well-known ATR-based SuperTrend.
Combining Fibonacci levels and regression to analyze multidimensional market trends across multiple timeframes¡
Universal multi time frame 'Moving Average' indicator with extended features
Initial Range – Where the open writes the script.
AI-powered KNN machine learning indicator for cTrader. Features dynamic ATR targets, trend filters & Telegram alerts.
AbsorptionRatio_AutoRiskPanel is a single–symbol Absorption Ratio engine for cTrader that auto–calibrates its risk thres
Pressure Scanner is a volatility-and-momentum to show both pressure states (squeeze on/off) and directional
Desde 21/04/2025