Descrição
Trend Scope Pro é um indicador técnico de nível profissional projetado para fornecer aos traders uma compreensão mais profunda da estrutura do mercado e da direção do preço. Construído com algoritmos avançados de regressão linear, esta ferramenta calcula uma linha de regressão dinâmica juntamente com três níveis de canais de desvio padrão. Ao combinar precisão estatística com clareza visual, ajuda você a identificar tendências atuais do mercado, zonas potenciais de reversão e faixas de volatilidade com facilidade, tornando-se uma adição acessível e poderosa a qualquer conjunto de ferramentas de negociação.
Como Ler o Trend Scope Pro
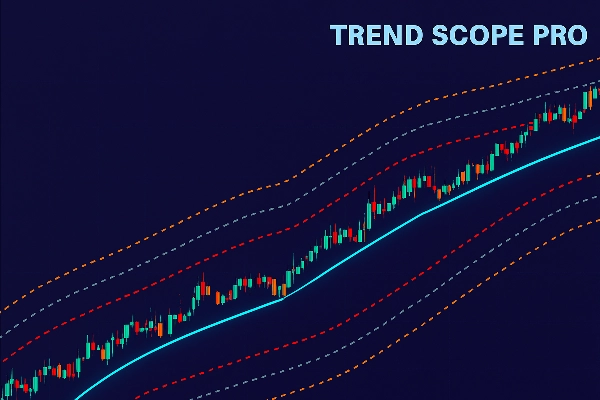
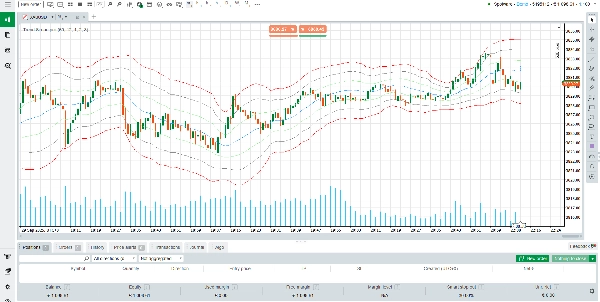
Quando aplicado ao seu gráfico, o Trend Scope Pro desenha uma linha central de regressão (azul), que representa o “valor justo” ou a direção média da tendência ao longo de um período definido. Ao redor desta linha, três conjuntos de canais superiores e inferiores são plotados (laranja, cinza e vermelho). Cada canal é calculado usando um multiplicador diferente de desvio padrão:
Superior/Inferior 1 (Laranja): Representa o primeiro desvio padrão. Movimentos de preço dentro desta zona frequentemente refletem volatilidade normal de curto prazo.
Superior/Inferior 2 (Cinza): Marca desvios mais fortes. Alcançar esta zona frequentemente sinaliza um movimento estendido ou desenvolvimento de momentum.
Superior/Inferior 3 (Vermelho): Zonas extremas onde o mercado pode estar sobrecomprado ou sobrevendido, criando oportunidades potenciais de reversão.
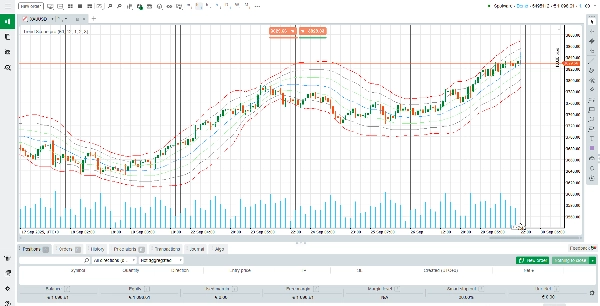
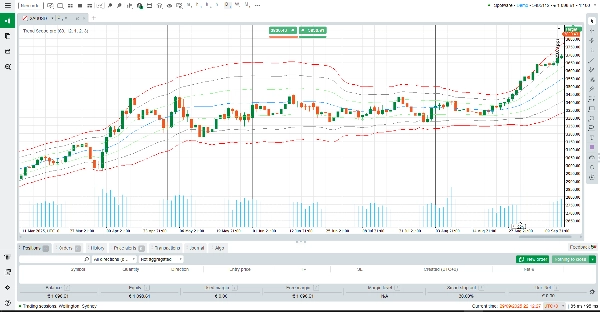
Na prática, os traders podem usar a linha de regressão para confirmar a direção da tendência, enquanto os canais atuam como níveis dinâmicos de suporte e resistência. Por exemplo:
Se o preço permanecer consistentemente acima da linha de regressão, a tendência é de alta.
Se o preço testar repetidamente ou romper abaixo da linha de regressão, a tendência está enfraquecendo.
Toques extremos nos canais vermelhos podem destacar pontos de exaustão, onde reversões ou recuos são mais prováveis.
Como o Indicador Funciona
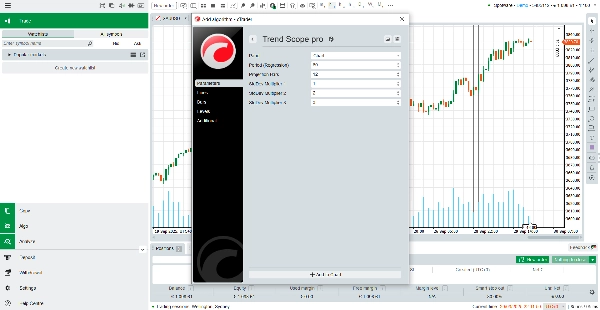
O Trend Scope Pro calcula uma linha de regressão analisando os preços de fechamento ao longo de um período de retrocesso escolhido. Em seguida, mede o desvio padrão do preço em relação a essa linha, o que determina a largura de cada canal. Essa abordagem estatística garante que o indicador se adapte à volatilidade em tempo real, proporcionando um equilíbrio entre sinais de seguimento de tendência e insights de reversão à média.
As configurações padrão (retrocesso de 60 barras, multiplicadores 1.0, 2.0, 3.0) são otimizadas para a maioria dos instrumentos, mas você pode ajustá-las facilmente para se adequar à sua estratégia ou período de tempo. Seja você um trader diário buscando entradas intradiárias, ou um trader de swing analisando ciclos de mercado mais amplos, o Trend Scope Pro oferece contexto confiável para a tomada de decisões.
Principais Características do Trend Scope Pro
Regressão Linear Adaptativa – Calcula dinamicamente a tendência central do mercado para um viés direcional preciso.
Canais em Múltiplos Níveis – Três conjuntos de bandas de desvio ajudam a identificar movimentos normais, tendências fortes e condições extremas.
Clareza Visual – Linhas limpas e codificadas por cores facilitam a interpretação da ação do preço num relance.
Configurações Personalizáveis – Períodos de retrocesso flexíveis e multiplicadores de desvio para combinar com qualquer estilo de negociação.
Em resumo, o Trend Scope Pro combina confiabilidade estatística com usabilidade prática. É mais do que apenas uma linha de tendência — é uma estrutura completa para analisar o comportamento do preço, identificar zonas de alta probabilidade e melhorar o timing das operações. Seja para buscar confirmação da tendência, antecipar reversões ou simplesmente adicionar estrutura aos seus gráficos, o Trend Scope Pro oferece a clareza e a confiança que você precisa.
Resumo
Avaliações de clientes
5 | 50 % | |
4 | 50 % | |
3 | 0 % | |
2 | 0 % | |
1 | 0 % |


