Descrição
TRB — Indicador Tick Runs Bars
Detecte Informações do Mercado Antes dos Movimentos de Preço
Preço introdutório por tempo limitado para adotantes iniciais - garanta sua cópia agora com preço reduzido antes que o valor aumente para o preço padrão de varejo após o término do período de lançamento inicial.
Versão 1.1
Use a seção de comentários para pedir mais detalhes
Disponível para sessão em vídeo com guia de configuração após a compra
INDICADOR TICK RUNS BARS (TRB)
Tick Runs Bars amplia a análise da microestrutura do mercado ao detectar persistência direcional no fluxo de negociações. Também baseado em Marcos López de Prado's Advances in Financial Machine Learning, este indicador identifica quando a pressão unilateral do mercado se desvia dos níveis esperados — revelando a fragmentação de ordens institucionais e atividade de negociação coordenada.
A Principal Percepção
Traders institucionais executam grandes ordens estrategicamente — eles as dividem em partes menores, escondem volume atrás de ordens iceberg, ou usam execução algorítmica para evitar mover o mercado. Essas táticas deixam impressões digitais distintas na forma de sequências persistentes de negociações unilaterais. Tick Runs Bars detecta esses padrões medindo quanto tempo um lado domina o fluxo de ordens, revelando quando uma ordenação deliberada e agressiva está ocorrendo em vez de flutuações aleatórias de preço.
Como Funciona
O indicador calcula separadamente o comprimento dos volumes de compra em sequência e dos volumes de venda em sequência — não compensando-os entre si como as métricas tradicionais de desequilíbrio. Ele acompanha a acumulação máxima de volume unilateral (θT) contra um limite esperado dinâmico derivado da probabilidade histórica de compra/venda e volumes médios. Quando as sequências direcionais reais excedem as expectativas, uma nova barra TRB é acionada. Isso revela a "forma estrutural" da execução do fluxo de ordens — a assinatura dos players institucionais em ação.
Principais Características
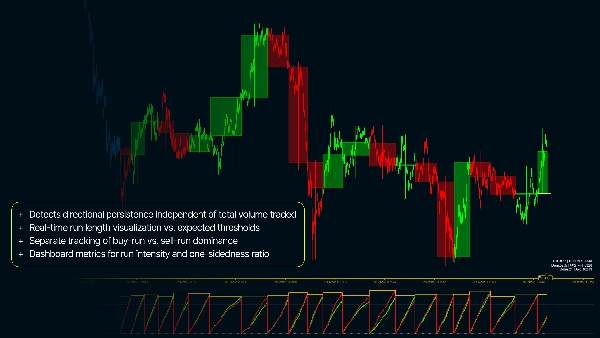
- Detecta persistência direcional independente do volume total negociado
- Visualização em tempo real do comprimento da sequência vs. limites esperados
- Rastreamento separado da dominância de sequência de compra vs. sequência de venda
- Coloração das velas do gráfico por associação TRB mostrando fases de execução de ordens
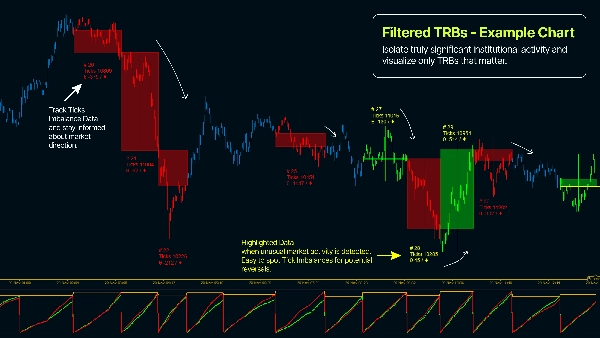
- Filtro de Volume Mínimo para isolar atividade institucional verdadeiramente significativa
- Métricas no painel para intensidade da sequência e razão de unilateralidade
- Parâmetros configuráveis de Tamanho Esperado da Barra e EWMA adaptados à volatilidade do instrumento
Por Que Usar Tick Runs Bars?
- Identifique a execução de ordens institucionais em tempo real — antes da conclusão
- Detecte liquidez oculta e padrões de ordens iceberg através da análise de fluxo
- Distingua negociações coordenadas do ruído aleatório do mercado
- Capture movimentos de preço a partir de desequilíbrios estruturais de ordens, não apenas anomalias estatísticas
- Cronometre entradas/saídas durante períodos de participação institucional conhecida
- Aplique teoria avançada de microestrutura de mercado para obter vantagem em prazos mais rápidos
- Reduza sinais falsos causados por picos menores de negociação de varejo


![Logótipo de "[Stellar Strategies] Smart ADX"](https://cdn.ctrader.com/image/webp/af13b084-b6f6-41db-b7bc-c7e688b57b05_36929)


