
BullMoonPerformance
インジケーター
61 ダウンロード数
バージョン 1.0、Feb 2026
Windows、Mac
5.0
レビュー: 1
説明
製品説明:BullMoonパフォーマンスパネル
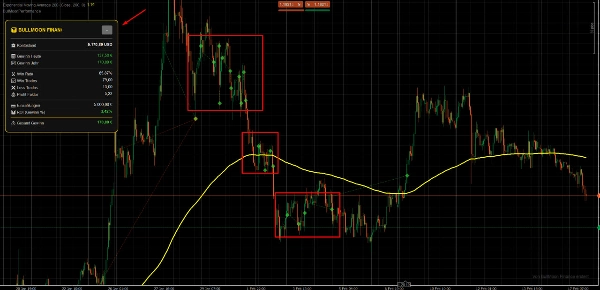
このBullMoonパフォーマンスパネルは、cTrader向けの強力な分析ツールであり、トレーダーがリアルタイムでパフォーマンスを監視し、過去の取引をチャート上に視覚的に再構築するのを支援します。
1. 市場データと状況
このパネルはあなたのアカウント関連の取引データと選択したシンボルの過去の価格データを分析します。
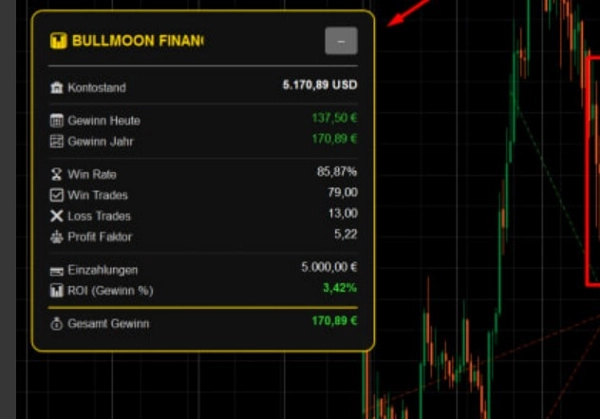
- 決済済みおよび現在進行中の取引の両方を評価し、純利益、ドローダウン、勝率などの主要指標を計算します。
- インジケーターは履歴をスキャンして、エントリーおよびエグジットポイントを正確に特定します。
2. シグナルと視覚要素の解釈
分析をできるだけ直感的にするために、このツールはチャート上に明確な視覚マーカーを使用します:
- シンボル: エントリーとエグジットは特定のシンボル(例:矢印や点)でマークされ、ポジションがどこで開かれ閉じられたかをすぐに確認できます。
- 視覚的な線: これらのシンボルを結ぶ線は取引の期間を示し、利益または損失のフェーズを視覚的に把握できます。
- ダッシュボード: コンパクトな画面上のダッシュボードは、USDでの利益、取引された合計ロット数、Rファクターなどの確かなデータを提供します。
3. 主要な設定とパラメーター
パネルはあなたの特定の取引スタイルに合わせてカスタマイズ可能です:
- 履歴期間: チャートに表示する過去の取引日数を定義します。
- 視覚要素: 勝ち取引と負け取引の色、線やシンボルの透明度は完全に調整可能です。
- 計算基準: 統計出力のために固定ロットサイズまたはパーセンテージベースのリスクを設定します。
4. 典型的な使用例と取引シナリオ
- 取引後の分析: 取引日を振り返り、戦略を正しく実行したかを確認します。
- 戦略の最適化: 利益確定や損切りのレベルが一貫して狭すぎるか広すぎるかを視覚的に特定します。
- ライブモニタリング: アカウント履歴タブを行き来せずに、現在の1日のパフォーマンスを追跡します。
5. 対象ユーザー(アカウントサイズと経験)
- 経験レベル: 取引感覚をより良く掴みたい初心者および迅速な視覚的パフォーマンスチェックを必要とするプロフェッショナルに適しています。
- アカウントサイズ: どのアカウントサイズにも適しており、特に複数の戦略を同時に運用し、明確な概要を維持する必要があるトレーダーにとって価値があります。
6. 重要な制限事項と使用上の注意
- プラットフォーム: cTrader専用に開発されています。
- データの可用性: 過去の取引の表示は、cTraderアカウント履歴内のデータの有無に依存します。
- シグナル生成ツールではありません: このパネルは分析ツールであり、独立した買いまたは売りのシグナルを生成しませんのでご注意ください。
概要
AIによる概要
BullMoon Performance Panel is an analytical indicator designed for the cTrader platform that visually reconstructs and monitors trading performance directly on the chart. It analyzes account-related trading data alongside historical price data of the selected symbol, evaluating both closed and open trades to calculate metrics such as net profit, drawdown, and win rate. Entry and exit points are precisely identified and marked with symbols like arrows or dots, connected by lines that illustrate trade duration and profit or loss phases.
The panel features a compact dashboard displaying key statistics including profit in USD, total lots traded, and the R-factor. Users can customize the display period for historical trades, adjust colors and transparency of visual elements, and set calculation parameters based on fixed lot sizes or percentage risk.
Typical use cases include post-trade analysis, strategy optimization by evaluating take profit and stop loss settings, and live monitoring of daily performance without switching views. The tool supports various markets and symbols such as Forex (EURUSD, GBPUSD, USDJPY), Indices (NAS100), Commodities (XAUUSD), Crypto (BTCUSD), and Stocks. It is suitable for traders of all experience levels and account sizes, especially those managing multiple strategies simultaneously. The panel is strictly an analytical tool and does not generate trade signals.
インジケーターのプロフィール
カスタマーレビュー
5.0
レビュー: 1
5 | 100 % | |
4 | 0 % | |
3 | 0 % | |
2 | 0 % | |
1 | 0 % |
カスタマーレビュー
March 5, 2026
BullMoonPerformance is a practical trading analytics panel that reconstructs your trades directly on the chart. Entries, exits and trade duration become instantly visible, making post-trade analysis much easier. The dashboard shows key performance metrics such as profit, lots and R-factor. A useful tool for reviewing strategy execution and understanding trading behavior. Ideal for traders who want to learn from their own history.
ディスカッション
よくあるご質問
BTCUSD
Forex
Indices
EURUSD
Commodities
GBPUSD
NZDUSD
Prop
Crypto
Stocks
XAUUSD
NAS100
USDJPY
cTrader Storeで入手可能な取引ボット、インジケーター、プラグインなどの商品は、第三者の開発者が提供するものであり、情報と技術の取得のみを目的としてご利用いただけます。cTrader Storeはブローカーではなく、投資助言や個人的な推奨を行うことも、将来のパフォーマンスを保証することもありません。
この作成者の他の商品
これも好きかも


価格
登録日 09/01/2026
834.97M
取引数量
520.52K
獲得pips
61
無料インストール