

Penerangan
PENGIMBAS ZON KONSOLIDASI NILAI TINGGI
Pengesanan Konsolidasi Pintar dengan Visualisasi Peta Haba
--------------------------------------------------
Cari zon konsolidasi berkemungkinan tinggi. Lihat di mana harga benar-benar diniagakan.
--------------------------------------------------
APA YANG DILAKUKAN PENUNJUK INI
Kebanyakan pengimbas konsolidasi hanya melukis kotak di sekitar julat harga. Penunjuk ini melangkah lebih jauh dengan menganalisis kualiti setiap sentuhan — membezakan antara badan dalam zon (penyertaan kuat) dan hanya sumbu (penyertaan lemah) sentuhan.
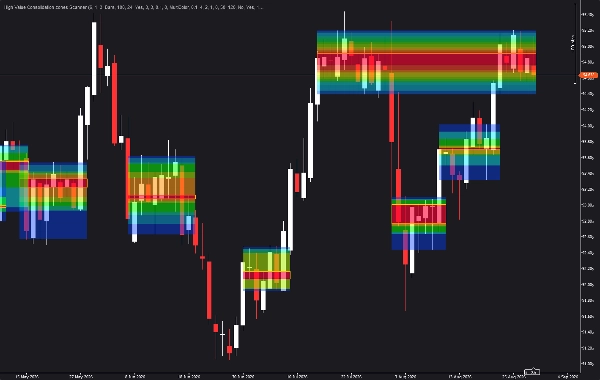
Hasilnya adalah peta haba yang menunjukkan dengan tepat di mana harga telah menghabiskan masa paling lama dalam setiap zon, membantu anda mengenal pasti tahap yang paling boleh dipercayai untuk kemasukan, keluar, dan penempatan hentian.
--------------------------------------------------
LOGIK TERAS DAN PENGIRAAN
Penunjuk mengimbas tindakan harga terkini untuk julat lilin yang bertindih. Apabila bilangan lilin yang mencukupi bertindih secara konsisten, zon konsolidasi dikesan. Bilangan minimum lilin berturut-turut yang diperlukan boleh dikonfigurasikan, begitu juga bilangan maksimum lilin yang tidak bersetuju dibenarkan dalam urutan tersebut.
Untuk setiap zon, penunjuk mengesan berapa banyak lilin yang mempunyai badan mereka di dalam zon berbanding berapa banyak yang hanya menyentuh zon dengan sumbu mereka. Lilin badan-dalam-zon menunjukkan penyertaan kuat, manakala lilin hanya sumbu menunjukkan minat yang lebih lemah. Perbezaan ini membentuk asas skor kekuatan.
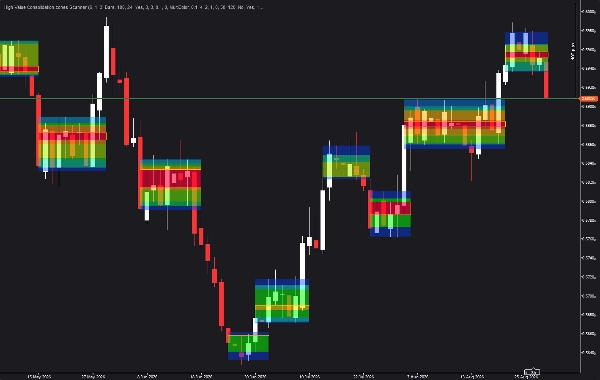
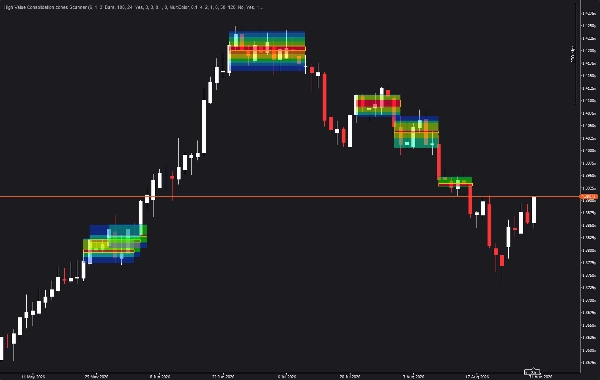
Peta haba dinamik dibina dengan menganalisis taburan aktiviti lilin dalam setiap zon. Tahap harga dengan aktiviti lebih tinggi ditunjukkan dalam warna yang lebih panas (merah/oren), manakala tahap aktiviti lebih rendah ditunjukkan dalam warna yang lebih sejuk (biru). Ini memberikan visual segera di mana harga benar-benar diniagakan.
Beberapa zon boleh digabungkan jika mereka bertindih dalam harga dan dekat dari segi masa, mengurangkan kekusutan carta dan mewujudkan zon yang lebih luas dan lebih bermakna.
--------------------------------------------------
CIRI-CIRI UTAMA
- PENGESANAN KONSOLIDASI AUTOMATIK: Mengenal pasti zon di mana lilin bertindih secara konsisten, dengan lilin berturut-turut minimum dan toleransi ketidaksetujuan yang boleh dikonfigurasikan.
- VISUALISASI PETA HABA: Menunjukkan ketumpatan aktiviti dalam setiap zon, dengan warna yang lebih panas menunjukkan aktiviti lilin yang lebih tinggi.
- SKOR BADAN VS SUMBU: Membezakan sentuhan kuat (badan dalam zon) daripada sentuhan lemah (hanya sumbu), menyediakan skor kekuatan untuk setiap zon.
- LOGIK PENGGABUNGAN: Zon bersebelahan yang bertindih dalam harga dan dekat dari segi masa digabungkan menjadi zon yang lebih luas dan lebih bermakna.
- AMARAN MASUK SEMULA ZON: Amaran pilihan apabila harga masuk semula ke zon yang dikesan sebelum ini, dengan masa rehat yang boleh dikonfigurasikan.
- PUDARAN UMUR: Zon secara beransur-ansur pudar apabila mereka berumur, mengekalkan fokus pada kawasan yang baru dan relevan.
- LOOKBACK BOLEH DIKONFIGURASI: Pilih antara tempoh lookback berdasarkan bar atau jam.
- PENAPISAN KEKUATAN: Tapis zon lemah berdasarkan skor kekuatan minimum.
- VISUAL BOLEH DISESUAIKAN: Warna zon, kelegapan isian, ketebalan sempadan, kedudukan label, dan lanjutan bar kanan.
--------------------------------------------------
PANDUAN PARAMETER
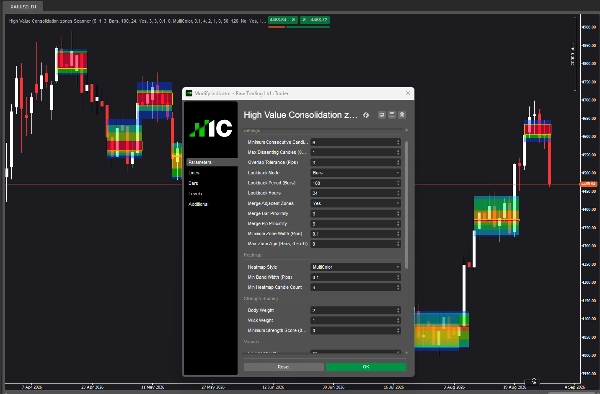
TETAPAN
Minimum Lilin Berturut-turut: Bilangan minimum lilin yang mesti bertindih secara konsisten untuk membentuk zon. Nilai yang lebih tinggi menghasilkan zon yang lebih besar dan lebih signifikan. Nilai yang lebih rendah menghasilkan zon yang lebih kecil. Lalai adalah 6.
Maksimum Lilin Tidak Bersetuju: Bilangan maksimum lilin yang tidak bertindih dibenarkan dalam urutan. Nilai 0 memerlukan pertindihan berturut-turut yang sempurna. Nilai yang lebih tinggi membenarkan beberapa jurang. Lalai adalah 1.
Toleransi Pertindihan (Pip): Toleransi dalam pip untuk menganggap lilin bertindih zon. Lalai adalah 3.0. Tingkatkan ini untuk zon yang lebih luas pada pasangan yang volatile. Kurangkan untuk zon yang lebih ketat.
Mod Lookback: Pilih antara Bar dan Jam untuk tempoh lookback. Mod Bar menggunakan bilangan lilin tetap. Mod Jam mengira bilangan lilin berdasarkan jangka masa carta.
Tempoh Lookback (Bar): Bilangan bar untuk mengimbas zon. Lalai adalah 100. Tingkatkan untuk zon jangka panjang pada jangka masa lebih tinggi. Kurangkan untuk fokus pada aktiviti terkini pada jangka masa lebih rendah.
Jam Lookback: Bilangan jam untuk mengimbas zon. Lalai adalah 24. Gunakan dengan mod Jam.
Gabungkan Zon Bersebelahan: Apabila diaktifkan, zon yang bertindih dalam harga dan dekat dari segi masa digabungkan. Lalai adalah benar.
Kedekatan Bar Gabungan: Bilangan maksimum bar antara zon untuk mempertimbangkan penggabungan. Lalai adalah 3.
Kedekatan Pip Gabungan: Jarak harga maksimum dalam pip untuk mempertimbangkan penggabungan zon. Lalai adalah 3.0.
Lebar Zon Minimum (Pip): Lebar minimum zon yang mesti ada untuk dipaparkan. Lalai adalah 0.1. Tingkatkan untuk menapis zon yang sangat sempit.
Umur Zon Maksimum (Bar): Umur maksimum zon dalam bar. Zon yang lebih tua daripada ini akan dikeluarkan. Lalai adalah 0 (mati).
PETA HABA
Gaya Peta Haba: Pilih antara Mati, MultiWarna, atau SatuWarna. MultiWarna menggunakan spektrum penuh dari biru ke merah. SatuWarna menggunakan variasi warna zon yang dipilih.
Lebar Jalur Minimum (Pip): Lebar minimum jalur peta haba individu. Lalai adalah 0.1.
Kiraan Lilin Peta Haba Minimum: Bilangan minimum lilin yang mesti bertindih jalur untuk dipaparkan. Lalai adalah 4. Tingkatkan untuk menunjukkan hanya jalur yang paling aktif.
SKOR KEKUATAN
Berat Badan: Berat yang diberikan kepada lilin badan-dalam-zon dalam skor kekuatan. Lalai adalah 2.0. Nilai lebih tinggi mengutamakan lilin dengan badan di dalam zon.
Berat Sumbu: Berat yang diberikan kepada lilin hanya sumbu dalam skor kekuatan. Lalai adalah 1.0. Nilai lebih rendah mengurangkan kepentingan sentuhan hanya sumbu.
Skor Kekuatan Minimum: Skor kekuatan minimum yang diperlukan untuk zon dipaparkan. Lalai adalah 0 (mati). Tingkatkan untuk menapis zon lemah.
VISUAL
Peratus Kelegapan Isian: Kelegapan isian zon. Lalai adalah 50 peratus.
Peratus Intensiti Warna: Intensiti warna zon. Lalai adalah 120 peratus.
Aktifkan Pudar Umur: Apabila diaktifkan, zon pudar apabila mereka berumur. Lalai adalah palsu.
Tunjukkan Sempadan Teras: Apabila diaktifkan, sempadan dilukis di sekitar zon. Lalai adalah benar.
Ketebalan Sempadan: Ketebalan sempadan zon. Lalai adalah 1.
Warna Zon: Warna yang digunakan untuk zon apabila peta haba dimatikan atau dalam mod SatuWarna. Lalai adalah Emas.
Tunjukkan Label: Apabila diaktifkan, label dipaparkan pada setiap zon. Lalai adalah palsu.
Tunjukkan Kekuatan Dalam Label: Apabila diaktifkan, skor kekuatan dipaparkan dalam label. Lalai adalah palsu.
Posisi Label: Posisi label pada zon: Atas, Tengah, atau Bawah. Lalai adalah Tengah.
Warna Label: Warna label zon. Lalai adalah Putih.
Lanjutkan Bar Kanan: Bilangan bar untuk melanjutkan zon ke kanan. Lalai adalah 0.
AMARAN
Amaran Pada Masuk Semula Zon: Apabila diaktifkan, amaran dicetuskan apabila harga masuk semula ke zon. Lalai adalah palsu.
Masa Rehat Amaran (Bar): Bilangan minimum bar antara amaran untuk zon yang sama. Lalai adalah 5.
--------------------------------------------------
KES PENGGUNAAN
- Kenal pasti zon konsolidasi untuk strategi pecahan atau pembalikan purata
- Gunakan skor badan-dalam-zon vs hanya sumbu untuk menilai kualiti zon
- Peta haba mendedahkan tahap harga yang paling aktif dalam setiap zon
- Amaran masuk semula zon menangkap ujian semula tahap utama
- Gunakan dengan penunjuk trend untuk menapis zon mengikut arah pasaran
- Letakkan hentian di atas atau di bawah zon konsolidasi berkualiti tinggi
--------------------------------------------------
ALIRAN KERJA YANG DISYORKAN
Langkah 1: Lampirkan penunjuk ke carta anda dengan tetapan lalai.
Langkah 2: Kenal pasti zon dengan skor kekuatan tinggi dan nisbah badan-dalam-zon yang tinggi.
Langkah 3: Periksa peta haba untuk melihat di mana aktiviti harga tertumpu.
Langkah 4: Gunakan zon sebagai tahap sokongan/rintangan berpotensi untuk kemasukan dan keluar.
Langkah 5: Aktifkan amaran untuk masuk semula zon bagi menangkap ujian semula.
--------------------------------------------------
CONTOH PRAKTIKAL
Pada carta EURUSD H1, penunjuk mengesan zon konsolidasi antara 1.0850 dan 1.0875 dengan 10 lilin berturut-turut. Zon itu mempunyai 8 lilin badan-dalam-zon dan 2 lilin hanya sumbu, memberikan skor kekuatan 18 (8*2 + 2*1).
Peta haba menunjukkan aktiviti tertumpu antara 1.0860 dan 1.0870 (jalur merah), menunjukkan di mana harga telah menghabiskan masa paling lama. Ini menjadi kawasan fokus anda untuk kemasukan.
Apabila harga menembusi zon ke atas dan kemudian mengujinya semula, amaran masuk semula dicetuskan, menyediakan peluang kemasukan kedua yang berpotensi.
--------------------------------------------------
NOTA TEKNIKAL
- Penunjuk lapisan (melukis pada carta harga)
- Berfungsi pada mana-mana jangka masa dan simbol
- Lookback boleh dikonfigurasikan (bar atau jam)
- Tiada cat semula; pengiraan adalah sejarah
- Dioptimumkan untuk prestasi
- Serasi dengan cTrader
--------------------------------------------------
SOKONGAN
Kemas kini seumur hidup disertakan.
UNTUK MAKLUMAT LANJUT - Klik Profil Pembangun di bawah.
Ringkasan
The indicator presents a dynamic heatmap within each zone, highlighting price levels with the highest trading activity using color gradients from cool (low activity) to warm (high activity). Adjacent zones that overlap in price and are close in time can be merged to reduce chart clutter and form broader zones. Zones can fade as they age to maintain focus on recent price action.
Additional features include configurable lookback periods (bars or hours), customizable visual settings (color, opacity, border thickness, labels), and optional alerts for price re-entry into detected zones. The scanner supports filtering zones by strength score and provides practical use cases for breakout or mean-reversion strategies, stop placement, and identifying key support and resistance levels. Calculations are historical with no repainting, optimized for performance.















![Logo "[Hamster-Coder] Pivot Points MTF"](https://cdn.ctrader.com/image/webp/4c143e5a-309c-40e3-a578-f04d1e133ffa_31159)











